INSIGHT: Indonesian Society for Knowledge and Human Development International Journal on Advanced Science, Engineering and Information Technology
Research Article, , https://doi.org/10.18517/ijaseit.14.4.19773
Optimization of BIPV utilization with parametric approach: Case study on Nearly Zero Carbon Building Studio Design in Medan, Indonesia
Achmad D. Nasution1, Dewi Larasati2,3, Sarah Nadia2,3, Arnott Ferels2,3, Yuli S. Indartono3,4, Harry Kurniawan5
Details
Authors
Achmad D. Nasution; Dewi Larasati; Sarah Nadia; Arnott Ferels; Yuli S. Indartono; Harry Kurniawan
DOI
10.18517/ijaseit.14.4.19773
URL
Publisher
INSIGHT: Indonesian Society for Knowledge and Human Development
Journal
International Journal on Advanced Science, Engineering and Information Technology
ISSN
2088-5334
Cite
Nasution AD, Larasati D, Nadia S, Ferels A, Indartono YS, Kurniawan H. Optimization of BIPV Utilization with Parametric Approach: Case Study on Nearly Zero Carbon Building Studio Design in Medan, Indonesia. International Journal on Advanced Science, Engineering and Information Technology. 2024;14(4):1383-1394. doi:10.18517/ijaseit.14.4.19773.
Abstract#
Buildings significantly consume fossil energy, leading to substantial carbon emissions contributing to global warming and rising sea levels. These environmental impacts pose serious challenges, necessitating a shift towards sustainable building designs. By integrating clean energy solutions into building architecture, we can reduce the environmental burden of emissions. This approach mitigates adverse effects on living organisms and ecosystems and promotes long-term sustainability and resilience in urban development. Building-Integrated Photovoltaic (BIPV) systems represent one such approach for substituting fossil energy. However, implementing BIPV effectively necessitates comprehensive analysis considering numerous parameters and variables. This paper introduces building design strategies employing the BIPV approach. The decision-making process in designing alternatives utilizes parametric methods, recognized for their ability to yield optimization results for various variables through the development of design algorithms. The study focuses on the design of a studio building at the University of North Sumatra. Comparative analysis of the results obtained through parametric design aims to identify the most favorable design outcomes. The research includes developing a parameterized design algorithm, workflow, and assessment results for selecting optimal design alternatives. The results indicate that the placement of PV panels on the side area (PVOS) has more potential than placement on the top area (PVOT). Despite the PVOT area being observed to be 0.57% smaller than PVOS, PVOS shows a significant increase in total Incident Radiation (IR), average IR, and total Energy Generated by 137.14%, 128.40%, and 132.97%, respectively.
Keywords#
BIPV; building design; Nearly Zero Carbon Building; parametric design
1. Introduction#
The elevated level of energy consumption in the building sector, constituting 40% of overall energy consumption [1], [2], [3], [4], [5] has become a significant concern for both developed and developing countries [6], [7], [8]. Addressing this concern requires the formulation of strategies [9], [10], focusing on energy efficiency and exploring energy conservation strategies by utilizing new renewable energy sources. This approach [11] not only enhances building performance [12] but also aligns with environmentally friendly practices [1]. Notably, building usage activities [13] contribute to more than 20–22% of emissions in the lifestyle sector [14], [15].
Cleaner energy alternatives [16] are imperative to sustain the use of buildings throughout their life cycle [17], [18]. Solar energy stands out [19] as one of the most abundant and readily available renewable energy sources in Indonesia [20] and Southern countries [21]. As of 2018, solar energy represents a clean energy option with substantial potential, capable of generating 28.2 MW of electricity, where 1 MW equals 1, 000, 000 W [22].
The abundance of solar exposure in Indonesia is attributable to its equatorial location [21], resulting in stronger and more intense exposure to sunlight compared to subtropical countries. Indonesia holds the third position among ASEAN nations [23] for the highest solar exposure intensity [24]. The solar energy potential in Indonesia [25] ranges from 3.4 to 4.8 kWh per day or 1200-1530 kWh/kWp per year [24]. To provide context, 1 kWh is equivalent to powering 1 LED lamp for 100 hours (about 4 days), 1 LCD TV for 10 hours, or a 2-door refrigerator for 8 hours. The installation of PV modules on high-rise buildings across Southeast Asian countries, including Indonesia, can significantly contribute to electrical energy production [26]. Indonesia’s technical Potential for PV in rooftop projects in the household sector [27] is estimated to be between 194 and 655 GWp. The realistic market potential is projected to be 17.8% [28].
Innovative building architecture with a focus on energy efficiency [29] often emphasizes optimal utilization of solar energy [30], [31], [32]. A strategy that can be applied is the Building Integrated Photovoltaic (BIPV) [33] design. The following research has studied the implementation of BIPV design strategies [34], [24]. The findings from these studies underscore the multifunctional role of BIPV technology, offering novel approaches to aesthetics [35], energy performance [36], and building efficiency [37]. As a rapidly evolving high-tech industry [38], photovoltaic (PV) technology has experienced cost reduction [39], improved conversion efficiency of cells [40], [38], and enhanced aesthetics. BIPV presents a tangible opportunity [33] to substitute conventional building materials and with additional revenue from PV energy generation [41], the overall building cost can become more cost-effective per square meter. However, the success of BIPV projects hinges on a comprehensive understanding [42], [43] of fundamental BIPV system principles, design strategies, integration techniques, architectural applications, and economic considerations [44], [45].
This aligns with various government regulations [46], [47], [48] emphasizing integrated solutions, which are expected to progressively foster the adoption of PV. These regulations outline renewable energy targets, aiming for a 23% mix by 2025 and an ambitious 31% by 2050 [49]. The target requires a substantial contribution from solar PV power generation, aiming for 6, 379 MW by 2025 and an even more ambitious goal of 45, 000 MW by 2050. This emphasizes the significant role [27], [50] that solar energy [51] is expected to play in meeting renewable energy targets and addressing the growing energy demand [52].
This will incentivize project developers, investors, and architects to incorporate BIPV design strategies [53], [54]. PV integration should be considered in building planning, potentially replacing traditional materials [55], [56] such as roof tiles and passive facade elements [34], [33], [57].
Based on the previous explanation, considering Indonesia’s potential as a tropical country with a solar energy capacity of 207, 898 MW [49], [25], architects/designers can utilize this resource [58] to design energy-efficient buildings by incorporating PV installations on the building envelope [59]. Using the design studio building project model in this research, the studio’s design will be analyzed for the potential of integrating PV energy into the roof envelope of the building.
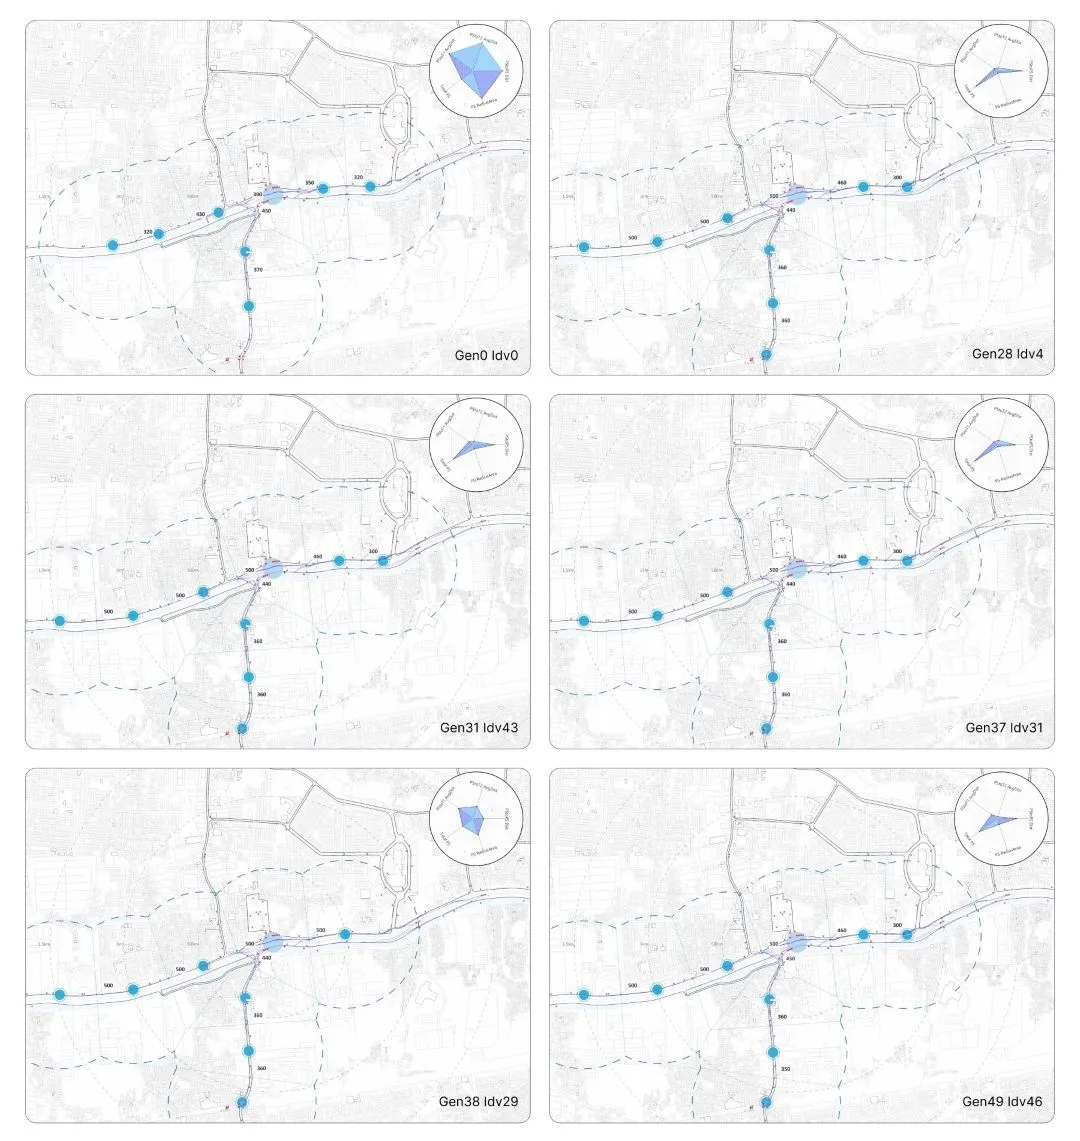
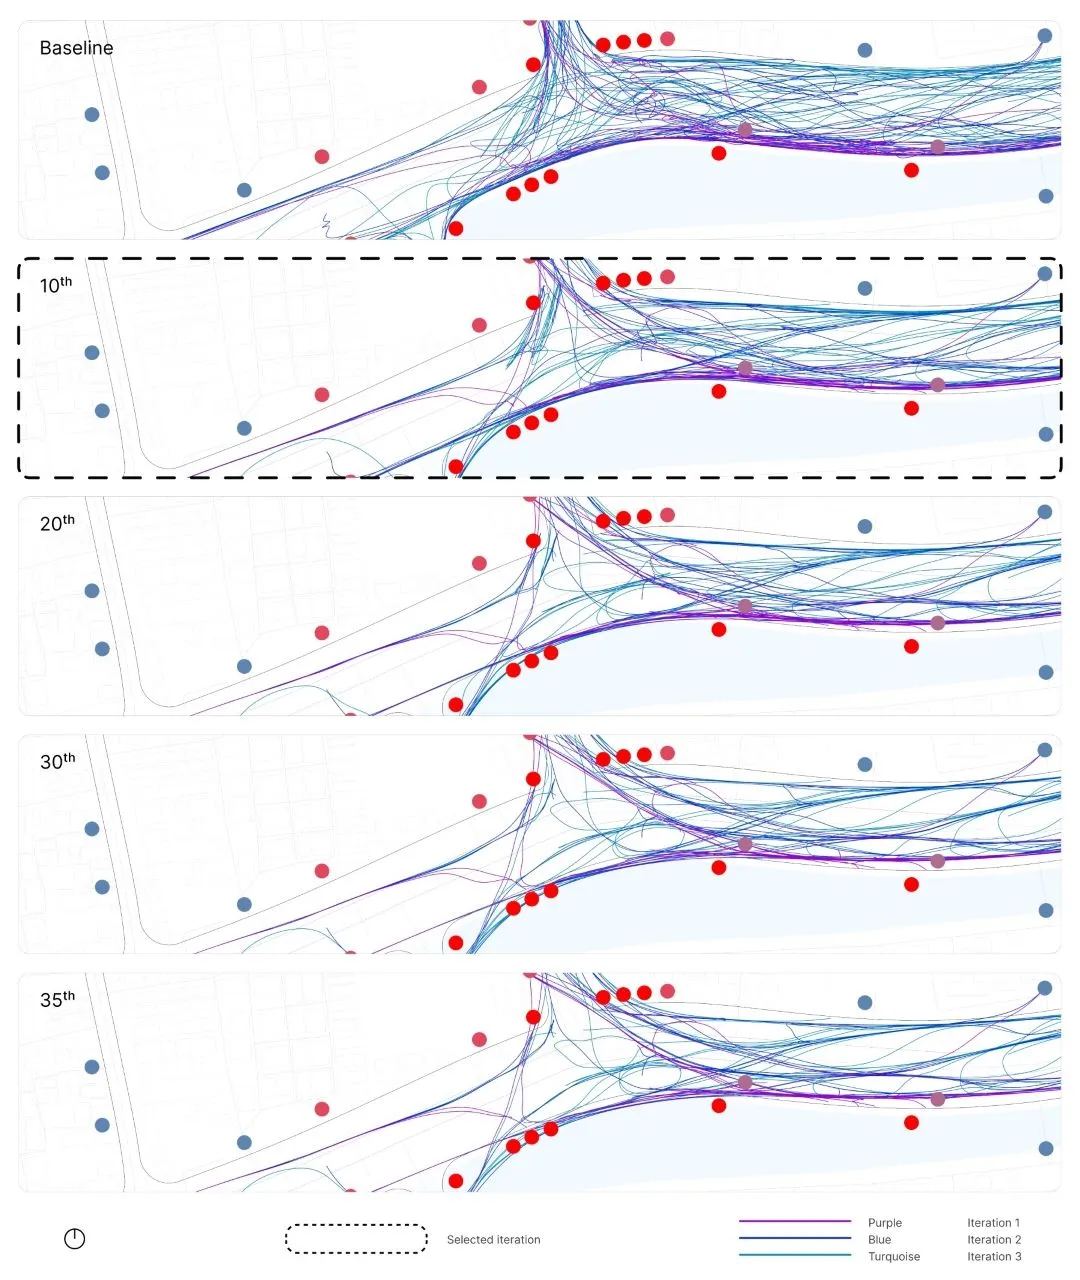
In determining the use of BIPV in buildings, various variables need consideration, including building design geometry [60], building elements, PV placement [61], [62], and more [63], [64], [65], [66]. The parametric approach [67], [68], [69] is deemed beneficial in the assessment process involving multiple variables [25]. Parametric architecture has evolved as a design process [70] that generates design alternatives based on input parameters [71]. With advancements in computational processes, parametric methods can produce diverse design solutions [67] responsive to specified parameters [72].
Apart from shape finding and conceptualization, parametric methods excel in optimization and customization [73] within an iterative process [74]. To enhance simulation efficiency and reduce inaccuracies, advanced modeling in BIM for optimizing BIPV [75], [76] should be developed [77]. Parametric studies go beyond abstraction modeling, incorporating the calculation of energy consumption [78], [79]. Parametric methods empower architects and/or designers to establish a pattern of relationships between parameters, typically numerical values influencing the final design output.
This research’s objective is to optimize BIPV use in a model project by exploring alternative PV placements through a parametric approach. The intention is that the models, workflows, parameters, and optimization algorithms developed from the multiple variables outlined in this research can serve as valuable insights for BIPV design in building projects in Indonesia.
2. Materials and Method#
2.1. Method#
This research primarily focuses on simulation data derived from different configurations of solar panel placement, specifically PV on the top (PVOT) and PV on the side (PVOS). The simulation utilizes EnergyPlus Weather (EPW) files obtained from the weather station IDN_SM_Medan.Kualanamu.Intl.AP.960350_TMYx.2004-2018 (MKIAP-960350). The selected PV module configuration is Monocrystalline [80] with the BIPV Colors Transparent type. The data collection process involves an analysis of the climatic characteristics and solar radiation at the research site using EPW files. Sun path diagrams and incident radiation (IR) [81] values are recorded to offer a comprehensive understanding of the solar energy potential in the region.
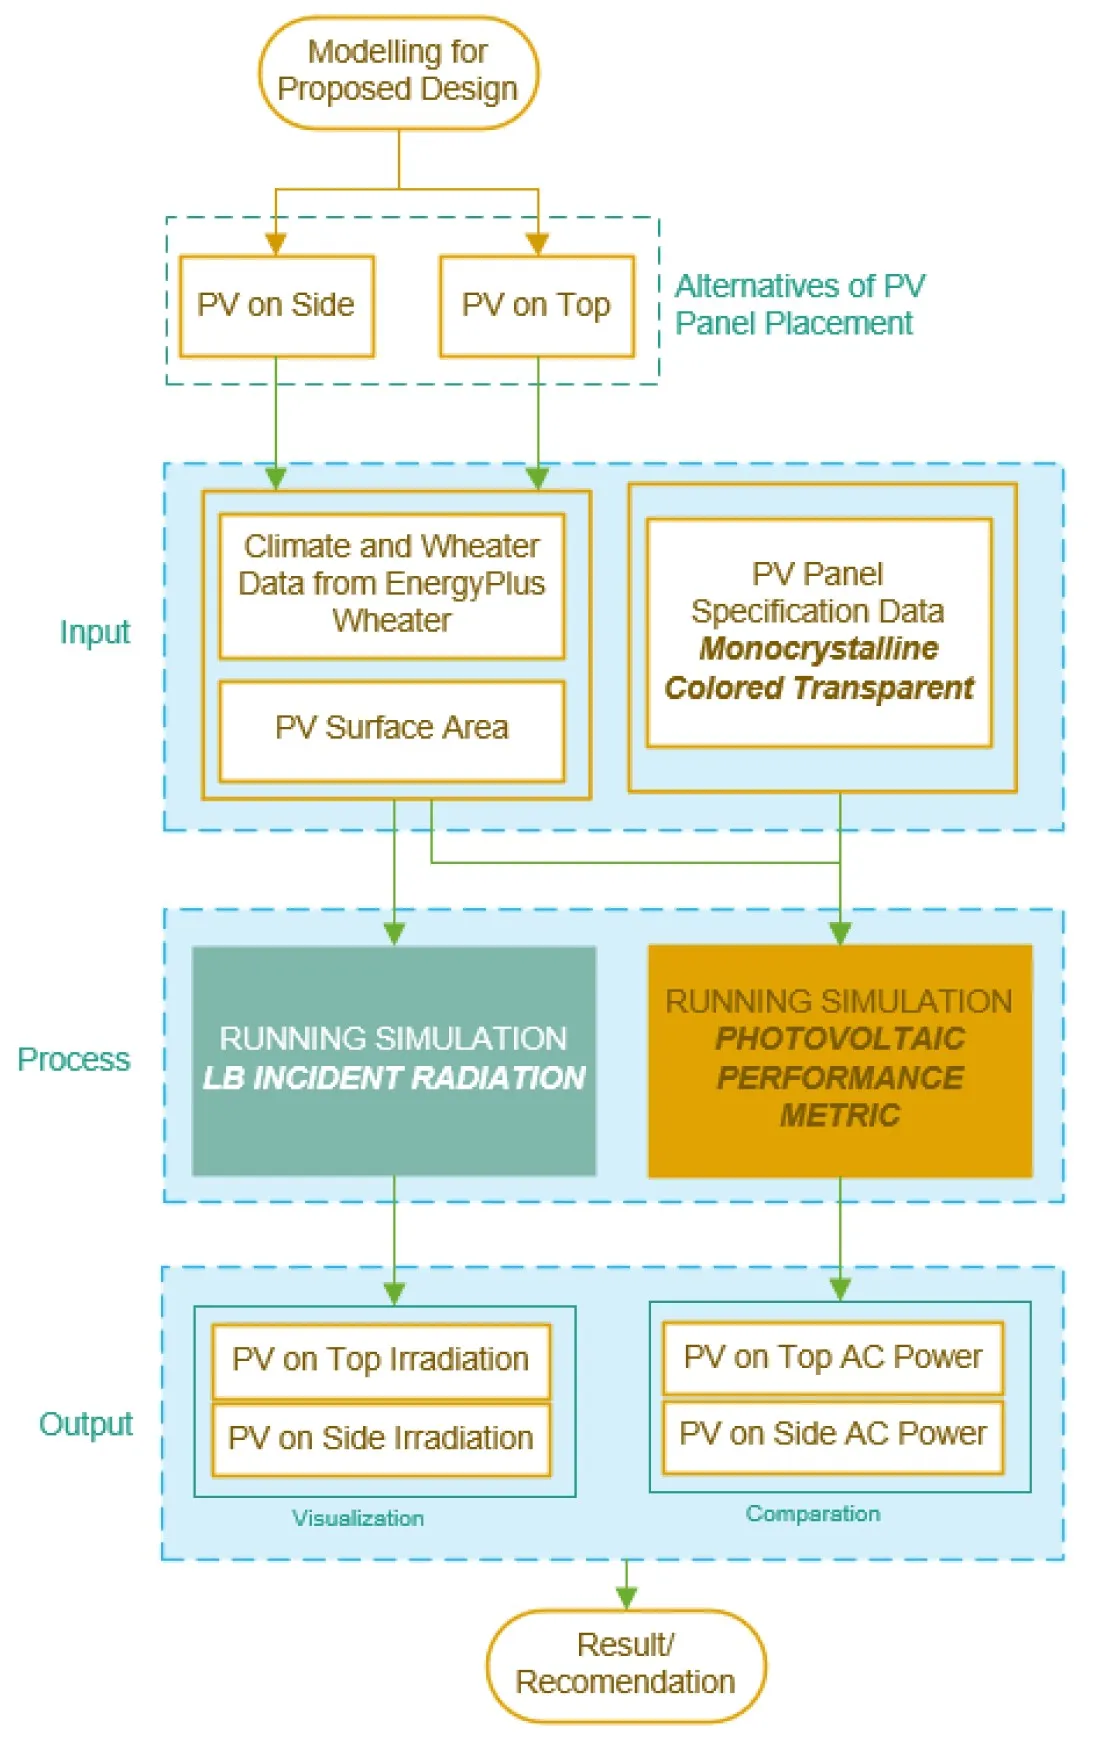
For further details, as depicted in the schematic diagram (Figure 1), input data utilizes a 3D model from the proposed studio design, supported by weather data obtained from EPW, as well as specifications of the PV panels to be utilized, in this case employing Monocrystalline Colored Transparent PV panels. Subsequently, after inputting the data, a simulation process is conducted, comprising incident radiation simulation utilizing LB incident radiation and PV performance metrics tools available in Grasshopper. The Incident Radiation simulation aims to assess the radiation exposure hitting the building’s surface, while the PV Performance Metric simulation aims to estimate the net energy value produced by a PV panel based on location, weather, and PV panel specifications. The results of both simulations are then considered to determine the appropriate PV panel design recommendation for the proposed studio design.
2.2. Study Object#
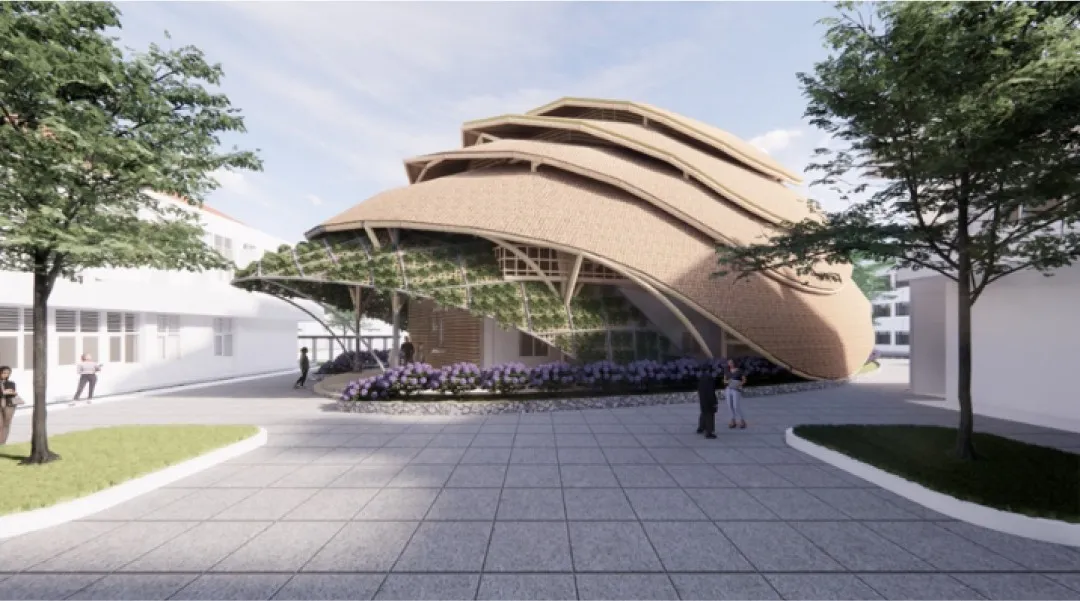
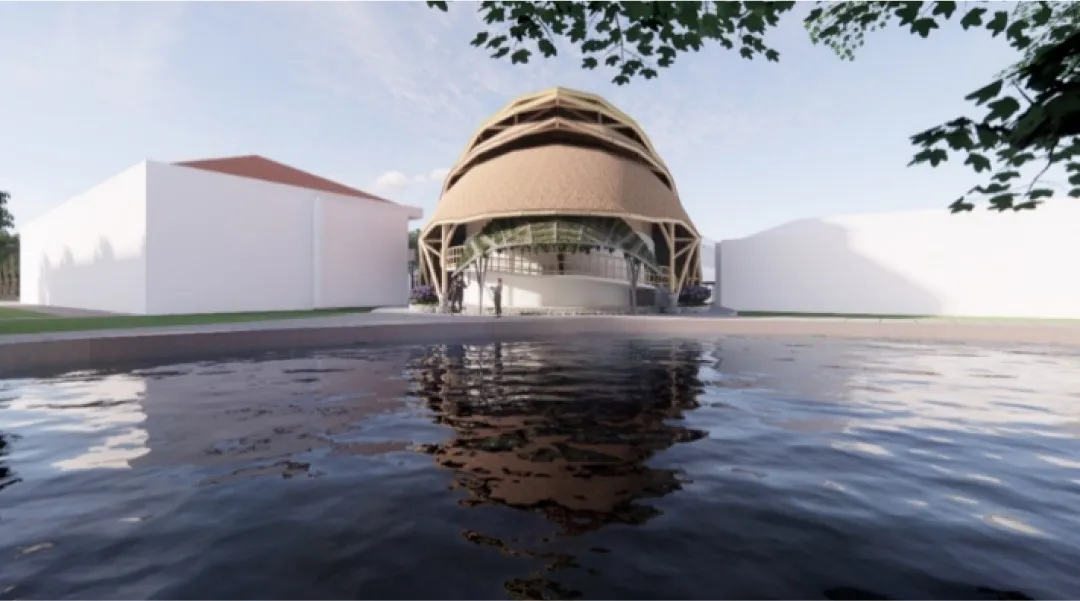
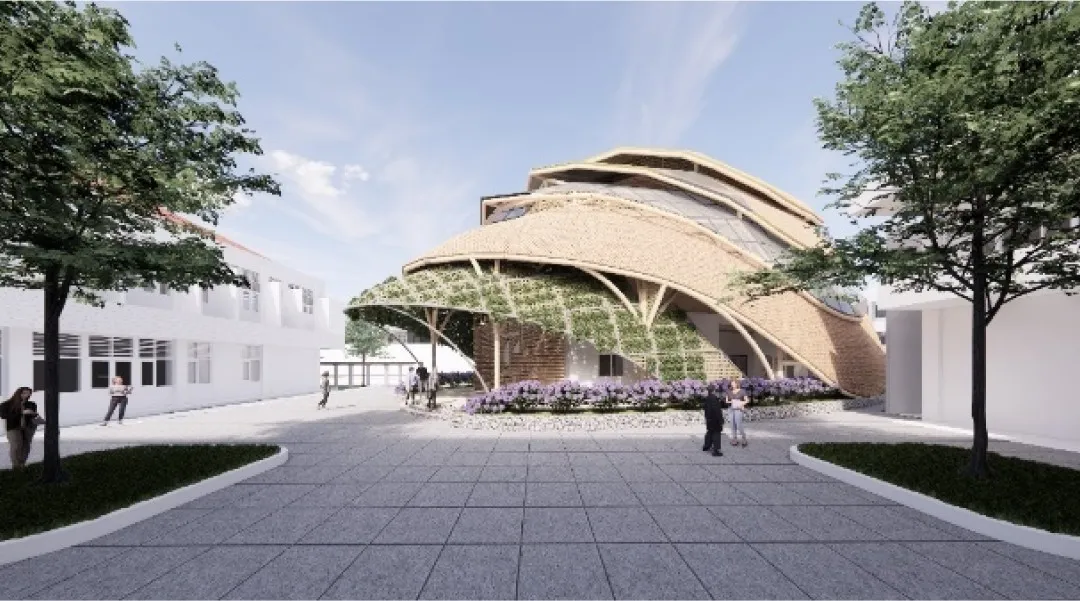
The subject of this research is an architectural studio building designed with the Nearly Zero Carbon Building (NZCB) approach, located within the University of North Sumatra (USU) Campus. Energy conservation in buildings extends beyond merely reducing energy consumption; it is a crucial element in curbing CO2 emissions from buildings [82]. According to the Canada Green Building Council, approximately 45% of the most significant carbon emissions emanate from buildings. Zero-carbon buildings are structures that generate emission-free energy from renewable sources, the value of which closely matches or equals the required energy consumption [83]. Building materials and the utilization of electronic and non-electronic equipment significantly influence a building’s CO2 emissions.
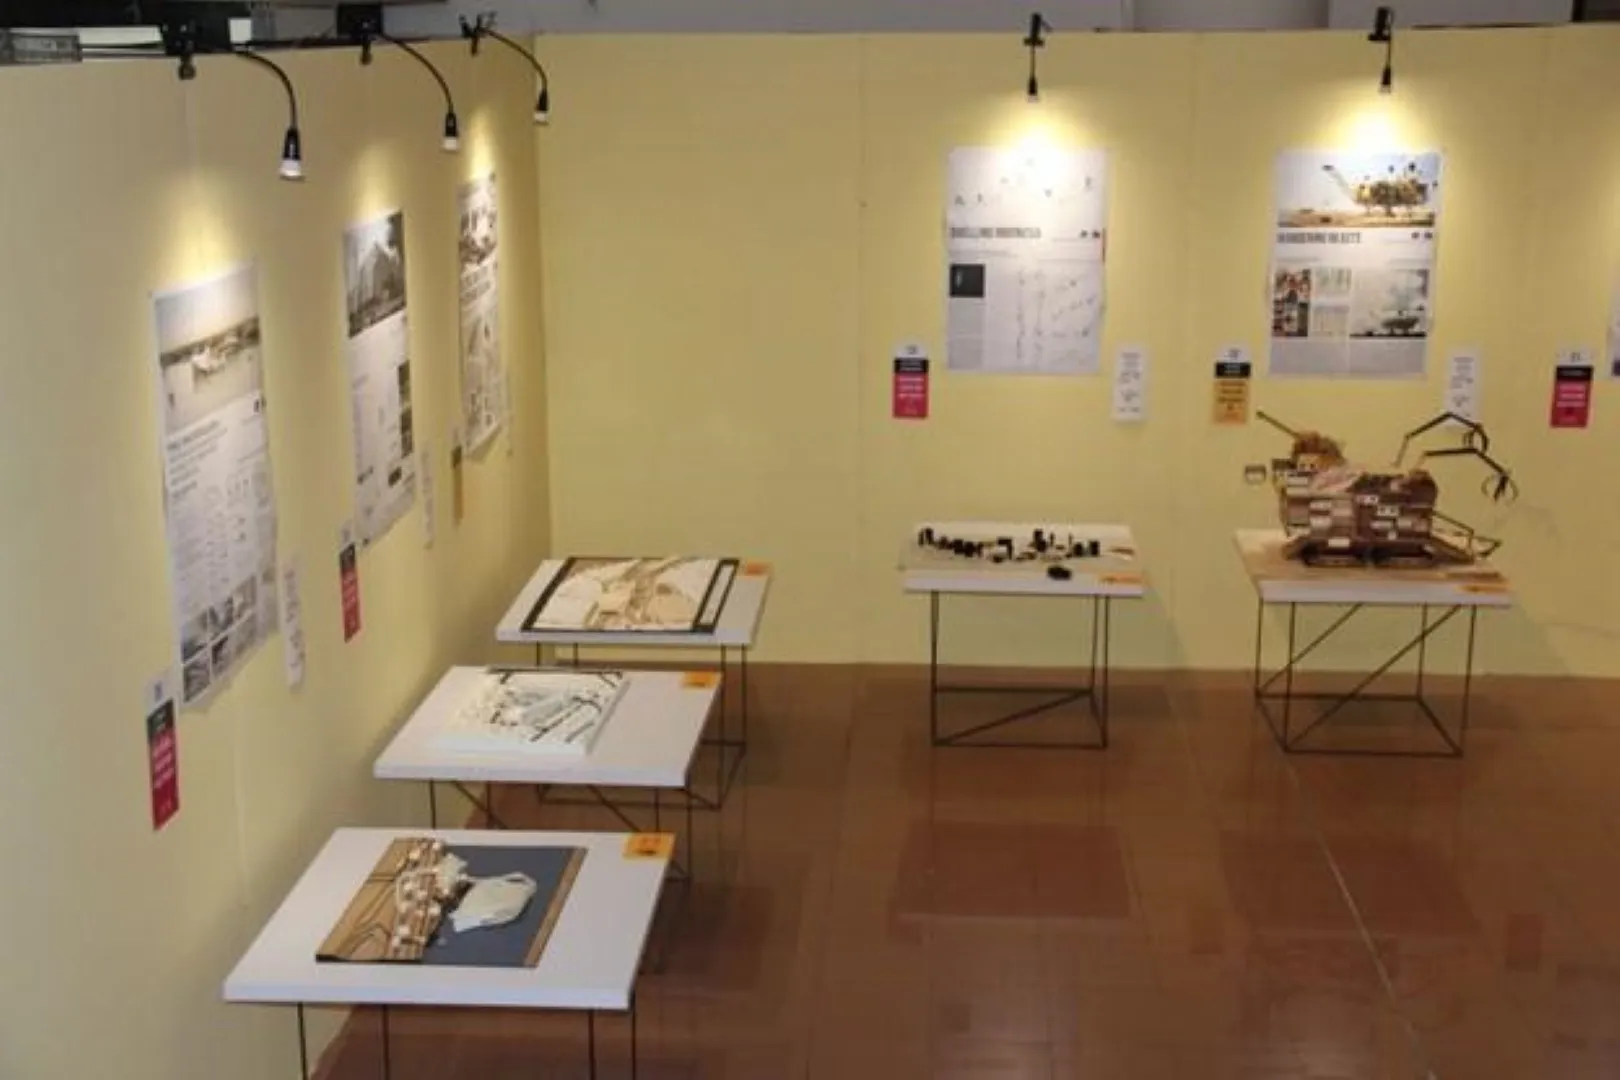
In alignment with these principles, the USU Architecture Studio Building design incorporates the Nearly Zero Carbon Building concept. The NZCB concept is manifested through landscape design, the selection of building materials, and integrating BIPV systems. The design of this project is influenced by the results of comparative studies conducted in Buluh Awar and Bukit Lawang. The primary material chosen for this design is bamboo, specifically Bamboo Betung. Preservation techniques are applied, involving a combination of natural and chemical methods. According to the comparative study’s findings, bamboo will be used in various aspects of the building, serving as the structural frame, roof covering material, and building walls.
Aside from being the largest oxygen producer among various tree species, bamboo exhibits a remarkable capacity for carbon absorption. This quality positions bamboo as a potential solution to address the issue of CO2 emissions in the atmosphere [84]. Global warming, increasing air temperatures, and climate change induced by greenhouse gases (GHG), particularly the elevated levels of CO2 in the atmosphere, can be mitigated through photosynthesis. Plants, with their ability to photosynthesize, absorb carbon dispersed in the air, and bamboo stands out as a plant with efficient photosynthetic capabilities (see Figure 2 and Figure 3).
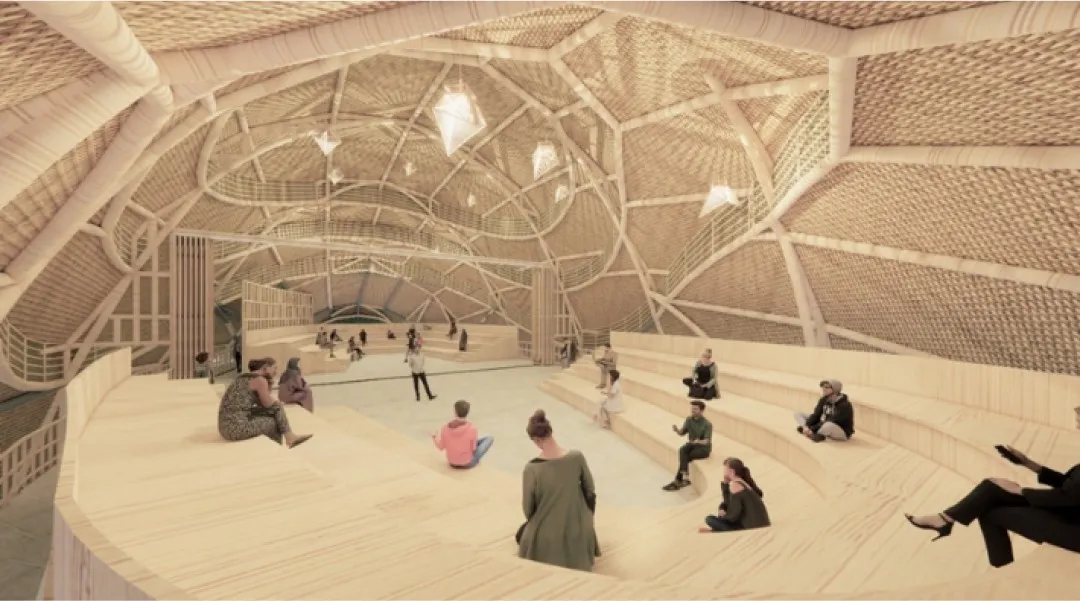
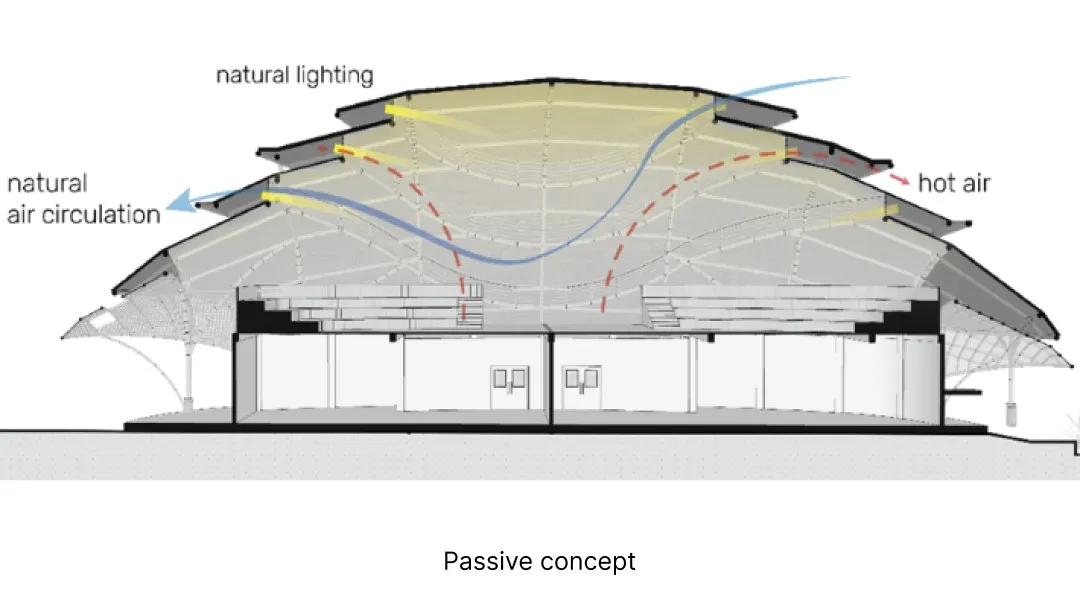
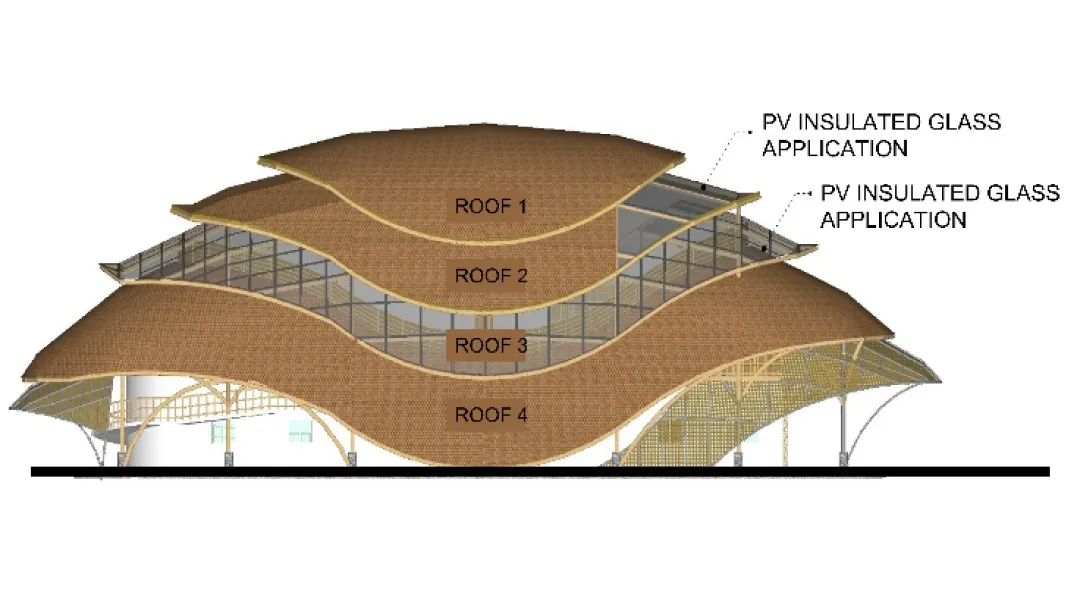
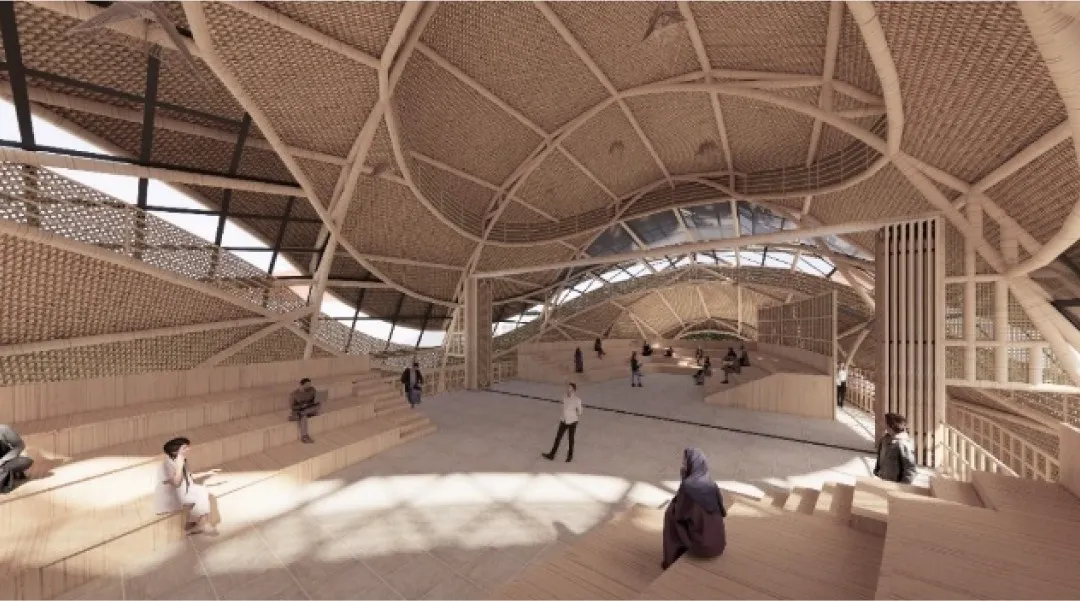
The utilization of artificial ventilation, such as fans and air conditioners, contributes to the emission of CO2 into the atmosphere. Air conditioners, in particular, generate approximately 904 tons of CO2 per year, while fans contribute 42 tons of CO2 per year [83]. Additionally, artificial lighting, in the form of lamps, contributes to carbon emissions ranging from 20% to 30% annually. These challenges can be addressed by applying a passive approach, emphasizing optimizing natural lighting and ventilation within buildings. However, achieving thermal comfort conditions requires engineering and the optimization of appropriate designs. Considering these factors, the design of the USU Architecture Studio Building prioritizes the optimization of natural lighting and ventilation. The louvers incorporated into the layers of the building’s roof play a key role in achieving this optimization. The multi-layered roof design is intended to facilitate the ingress of natural light and air into the building, contributing to a sustainable and energy-efficient approach (Figure 4).
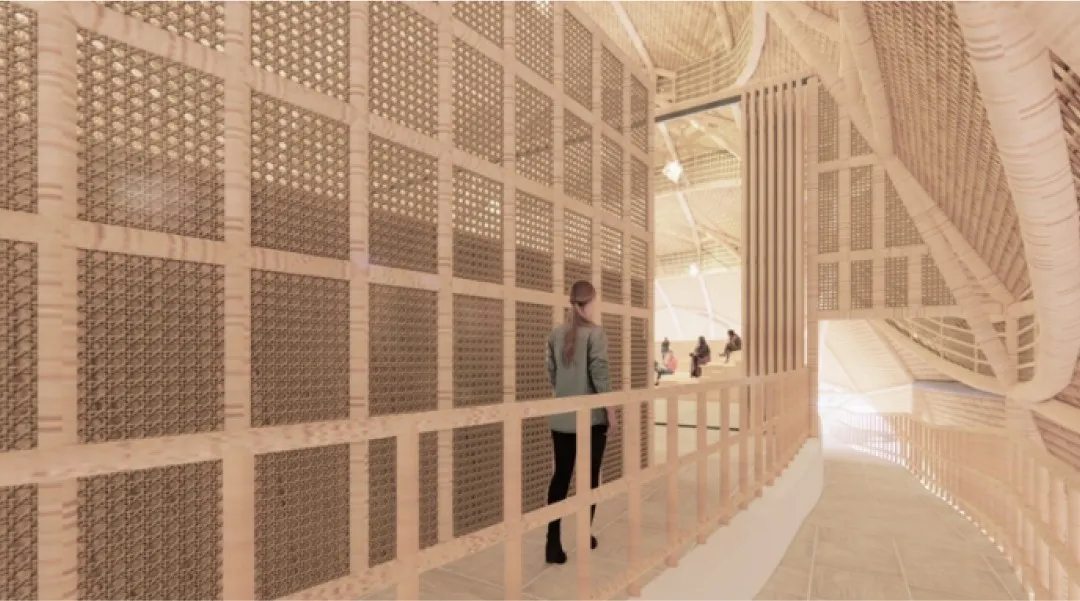
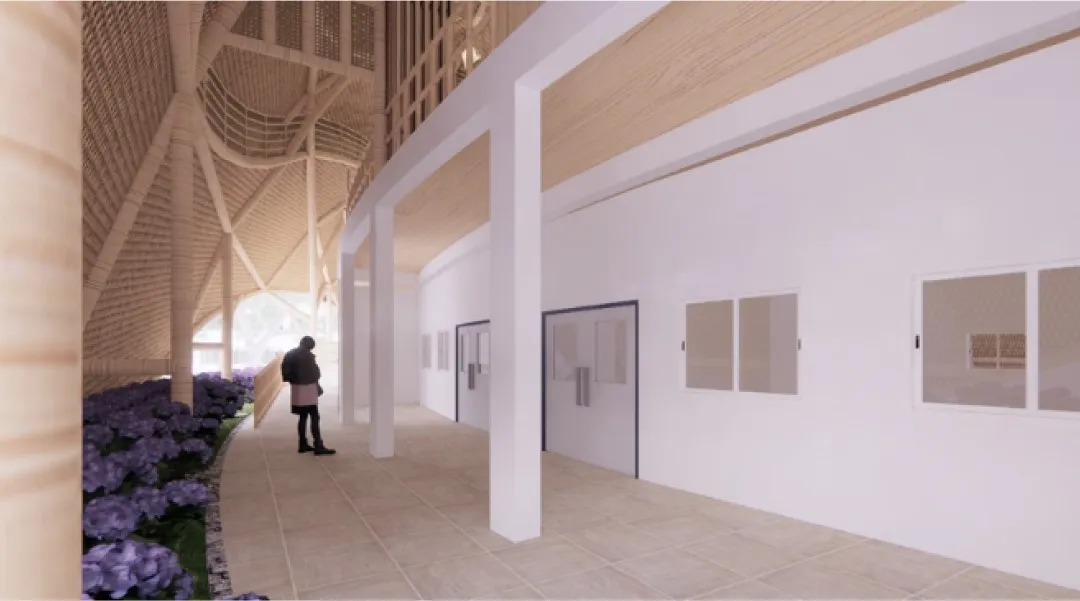
The building’s walls are constructed using woven bamboo material, intentionally designed to create gaps that allow the entry of natural airflow. These gaps or grilles in the wall material serve a dual purpose by facilitating fresh air into the building and acting as conduits for natural lighting. This design promotes both ventilation and the penetration of natural light, contributing to the overall sustainability and energy efficiency of the structure (see Figure 5).
Furthermore, the building incorporates thermal comfort engineering through a pond on the north side or rear of the structure (see Figure 6 and Figure 7). This pond is a natural insulator, effectively lowering the surrounding air temperature. Additionally, canopies made of an iron frame with vines are positioned on the right and left sides of the building’s facade, acting as overhangs. Complementing these canopies, vegetation is strategically placed around the building. The vegetation on the canopy and surrounding areas serves as an efficient building envelope, minimizing the impact of solar radiation entering the building.
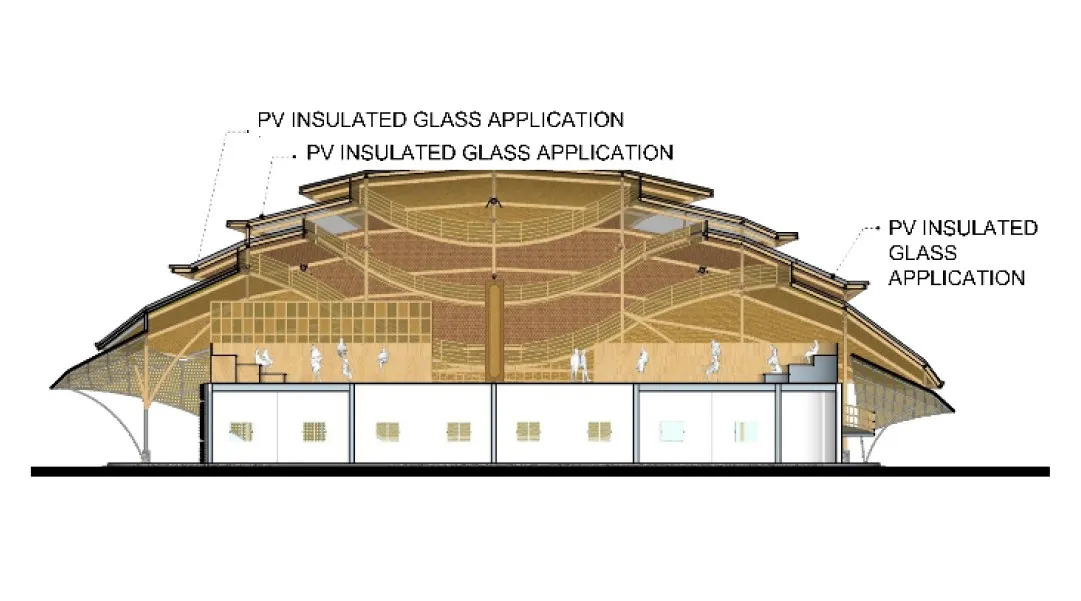
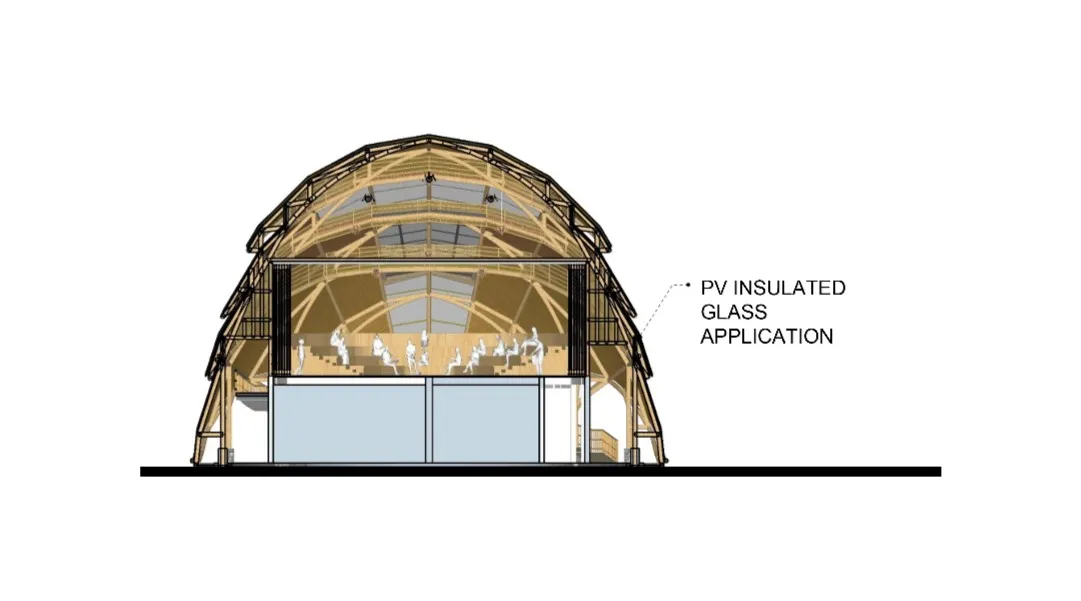
This building is designed by incorporating the design and optimization techniques described above to achieve thermal comfort values without reliance on artificial ventilation and to minimize the need for artificial lighting. In line with sustainability and design advancements, the architectural studio building is designed with the application of the NZCB concept, and a notable addition is the use of Photovoltaic Insulated Glass (PVIG). This type of glass is integrated with PV technology, allowing it to convert sunlight into environmentally friendly electrical energy. PVIG also has heat insulation technology to reduce heat radiation entering the building. Integrating this glass into the architectural studio building design with the NZCB concept is anticipated to yield significant energy savings in building operations, particularly in the reduction of energy required for cooling.
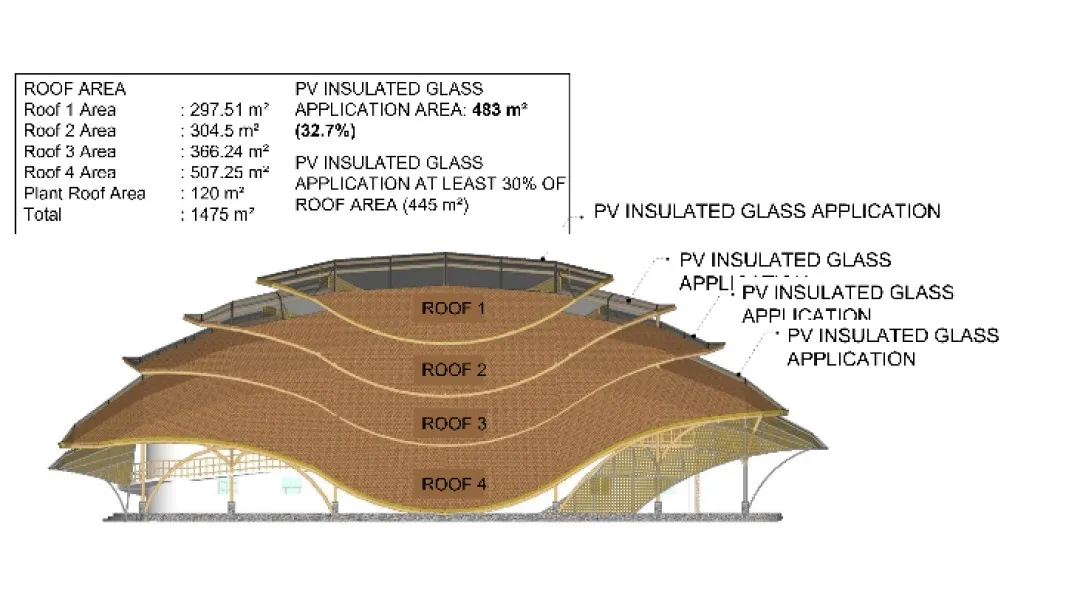
In determining the optimal position for PV panels on the building, it is essential to analyze their performance on the structure first. This testing involves evaluating two alternative designs to assess the superior performance of PV placement. In the first alternative (Alt. 1), the PV application covers two areas: the entire roof of layer 3 and the southeast-facing side (PV on the top or PVOT). This aligns with the requirement for the PV application area on the building, set at 30% of the roof area. The total area of the roof design is 1, 475 m², resulting in a total PV application area of 445 m². In the design implementation, the distribution of PV panels occurs on the roofs of the 2nd and 3rd levels, with areas of 304.5 m² and 366.24 m², respectively (see Figure 8).
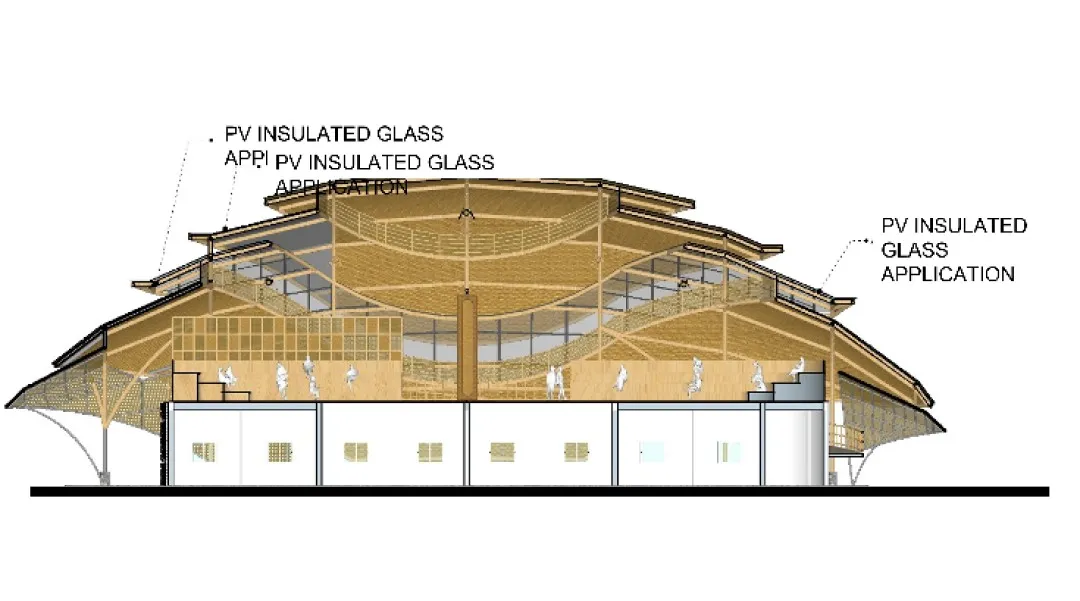
The positioning of the glass is analyzed based on solar analysis at the site. The facade plane’s orientation is such that the PV panel covers the entire 3rd roof plane and faces southeast. The variation in the type of PVIG installation technique applies to a hybrid PV light shelf system. This technique allows PV to be freely installed on the building skin, acting as sun shading with an uncomplicated and cost-effective structural system. This specific placement position and installation technique ensure that the glass functions effectively, producing environmentally friendly electrical energy and enhancing thermal comfort within the interior spaces (see Figure 9, Figure 10, and Figure 11).
In the second alternative (Alt. 2), the PV position stretches parabolically on each roof layer (PV on the side or PVOS). On the top roof (roof layer 1), PVIG covers the entire roof surface. Like Alt. 1, the placement of PV on the building adheres to the requirement of a minimum PV application area, which is 30% of the total roof area of the building. In the second alternative, the PV application area on the building is 32.7%, equivalent to 483 m² (see Figure 12).
The rationale for situating the PV position in Alt. 2 is grounded in solar analysis. According to the analysis findings, the rooftop location is not subjected to shading from neighboring structures. Consequently, incorporating PV systems in buildings can encompass a greater surface area, thereby enhancing the overall performance of PV in energy conservation within buildings. Additionally, this deployment is anticipated to contribute to the improvement of thermal comfort within the buildings (see Figure 13, Figure 14, and Figure 15).
The subsequent phase involves conducting a comprehensive design analysis following the design development for incorporating PVIG in the building. This analysis will delve into the strategic positioning and placement of PVIG within the building structure.

Additionally, the study will assess the capacity of bamboo material to sequester carbon. The analysis will extend to evaluating the synergistic impact of bamboo materials and PV technology in mitigating embodied carbon and reducing dependence on fossil energy within the building context. Simultaneously, the building’s potential to generate new energy (measured in kWh) will be scrutinized. This multifaceted design analysis aims to provide a thorough understanding of the ecological and energy-related implications of the proposed integration of PVIG and bamboo material in the building design.
2.3. Parametric Approach in Determining Design Results#
This research employs a parametric approach to evaluate the efficacy of BIPV within the proposed building design. The parametric methods utilized for BIPV align with the scope outlined by the International Energy Agency [85], as below:
- Establish a local data repository encompassing weather data, adherence to building regulations, energy consumption across diverse building sectors, utility pricing structures, construction and maintenance expenditures, various contract types, financing modalities, carbon pricing, and government incentive programs.
- Streamlined generation of three-dimensional (3D) models depicting the physical environment with efficiency.
- Comparative analysis of energy input and output hourly.
- Optimization of PV layout design for enhanced efficiency.
- Simulation of the installation process accompanied by impact analysis.
- Integration of a monitoring and inspection module featuring automatic diagnostic capabilities.
- Recording and documentation of the performance metrics of the PV system.
- Conducting sensitivity analyses and facilitating scenario-based decision-making support.
During the parametric analysis stage, iterative modeling becomes imperative. Drawing from various sources, several tools have been employed for this purpose, with Rhinoceros [86] + Grasshopper [87] identified as one such tool [88]. Additionally, alternative frameworks have been identified, exemplified by the divisions proposed by [89], encompassing input parameters, parametric 3D models, solar radiation analysis, and electrical performance analysis.
The scope of the data analyzed extends to include irradiation, indoor temperature, indoor lighting, external temperature, wind speed, and energy load, as indicated in the research by [90]. The breakdown of parametric analysis within the context of BIPV utilizing PVSITES simulation media is delineated as follows, as outlined in the work by [91]; location and weather, irradiation data, BIPV module selection, and BIPV layout.
This research employs a simulation-based approach to assess solar panel placement, specifically focusing on two configurations, PVOT and PVOS, as mentioned in the previous section for each alternative. The simulation utilizes EPW weather data [92], [93] obtained from the MKIAP-960350 weather station [94]. The selected PV module configuration is Monocrystalline, characterized as BIPV Colors Transparent type. EPW files facilitate the data collection process by meticulously analyzing climate characteristics and solar radiation at the study location.
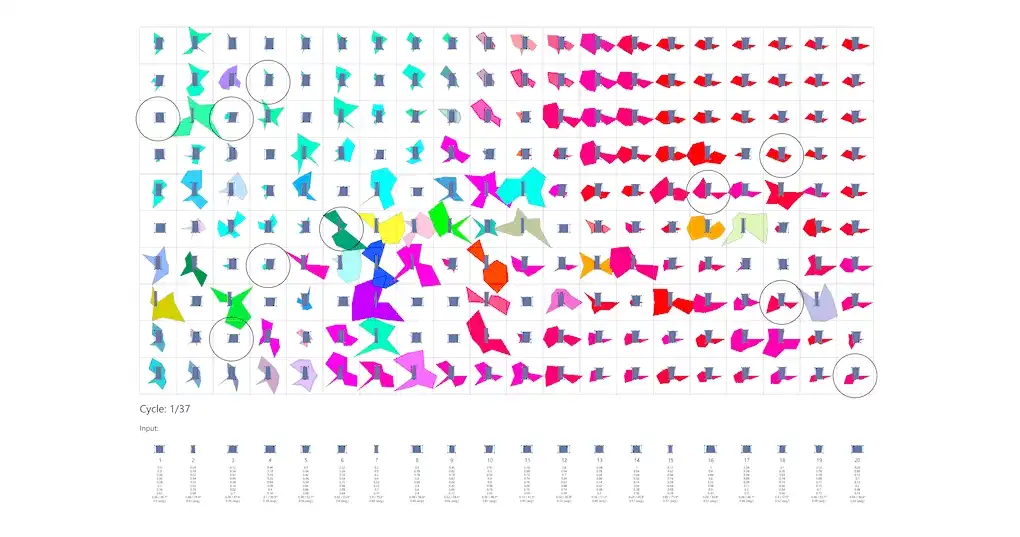
To visualize and record essential parameters, Sun path diagrams and the recording of IR values are employed [94]. In Figure 15, the workflow script in Grasshopper is depicted, illustrating the integration of EPW files and module configuration parameters such as PV surface Percent 90, mount type 2, module Efficiency 19.52, Temperature Coefficient -0.36, and module Active Area Percent 90.
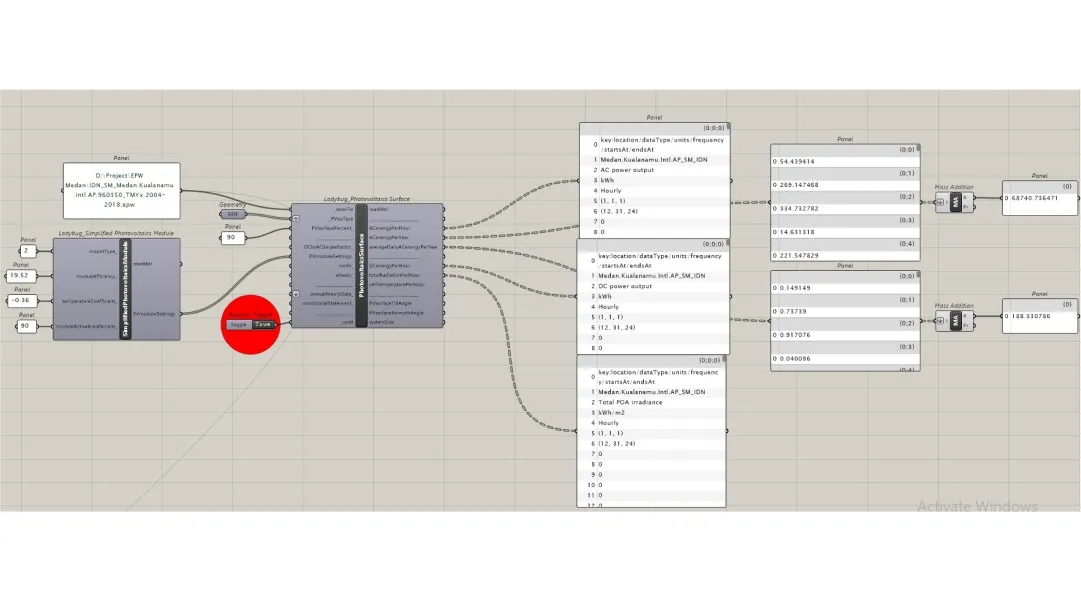
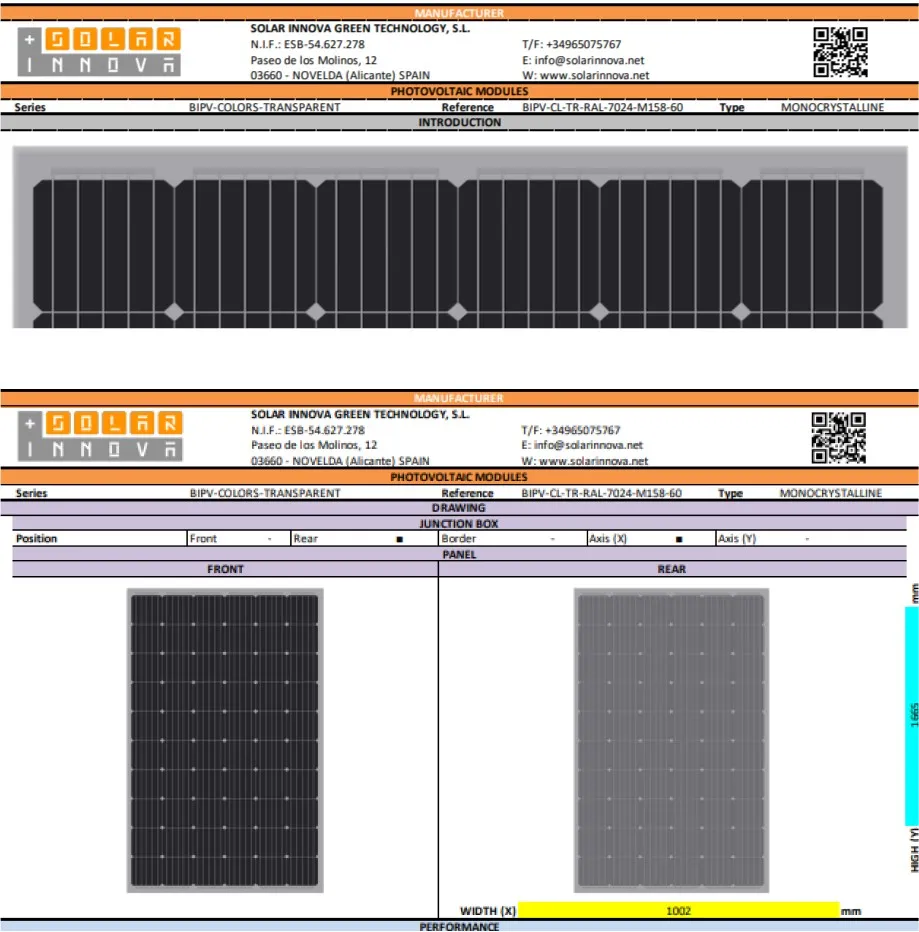
The distinction in geometry between PVOT and PVOS, as illustrated in Figure 16, results in divergent outputs for ACenergyPerHour (alternating current/AC energy per hour), ACenergyPerYear (alternating current/AC energy per year), averageACenergyPerHour (average alternating current energy per hour), DCenergyPerHour (direct current/DC energy per hour), and totalRadiationPerHour (total radiation per hour). Figure 17 provides details of the module configuration employed in the simulation, highlighting the BIPV Colors Transparent PV module by Solar Innova Green Technology from Spain and specific specifications.
Input EPW file from EPW MKIAP-960350 data, with PV surface percentage set at 90. Configuration of Monocrystalline BIPV Colors Transparent PV modules include Ladybug_Simplified Photovoltaics Surface [95] and Ladybug_Simplified Photovoltaics Module [96] with mountType_ 2, moduleEfficiency_ 19.52, temperatureCoefficient_ -0.36, and moduleActiveAreaPercent_ 90.
The choice of the Monocrystalline BIPV Colors Transparent module type stems from its technical advantages in efficiently harnessing solar energy and its capacity for seamless aesthetic integration with the building structure. Parameters such as module efficiency, temperature coefficient, and module active area percentage were meticulously chosen to ensure optimal performance. This decision was made by thoroughly reviewing existing literature and leveraging technical insights from the PV industry.
The selection of Medan Kualanamu International Airport [97] as the source of EPW data was predicated on its accuracy in representing climatic conditions and solar radiation in the designated study area. EPW file characteristics, encompassing annual data spanning from 2004 to 2018, were carefully considered to comprehend climate variations throughout the relevant period. This strategic choice ensures that the simulation yields pertinent results, faithfully representing the actual conditions prevailing at the study location.
3. Results and Discussion#
3.1. Result#
The simulation results serve as a foundational element for subsequent design considerations. The PVOS placement demonstrates optimal potential for harnessing solar radiation on the roof of the building, whereas PVOT exhibits significant potential for generating high electrical energy on the building’s side. The design process must carefully account for these factors, emphasizing both energy performance and the seamless aesthetic integration of the solar panels with the building structure. Balancing these considerations will be crucial in achieving an effective and visually harmonious integration of solar technology into the overall architectural design.
Upon careful consideration of the PV electrical energy generation simulation, the PVOS placement was selected due to its superior potential to generate substantial electrical energy compared to the PVOT placement.
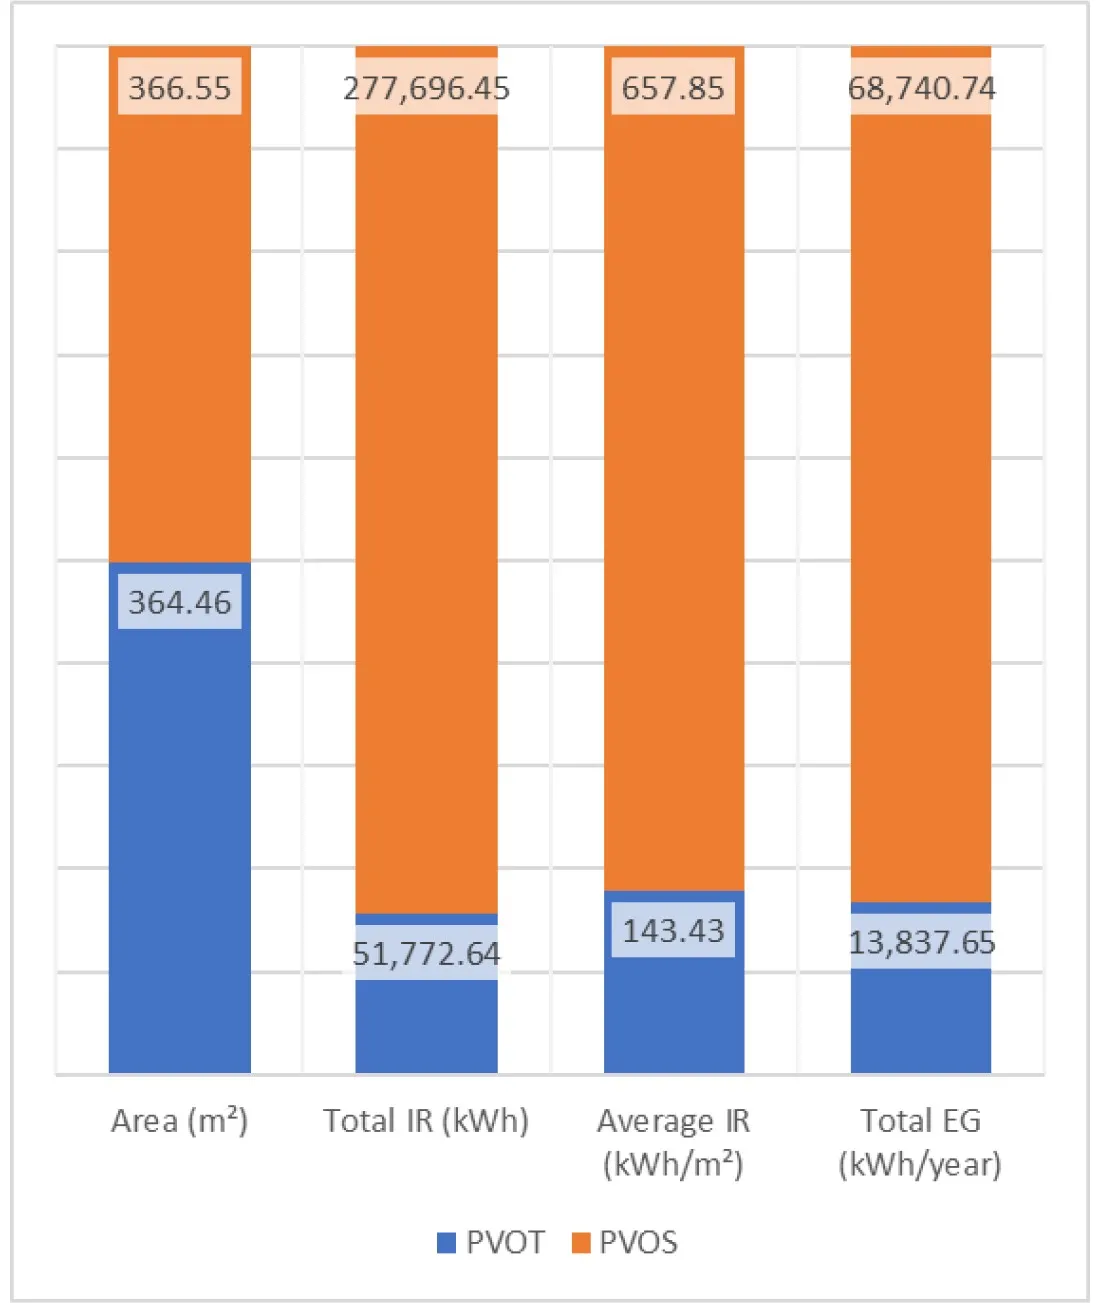
Table 1 presents a comprehensive comparison of results between PVOT and PVOS, encompassing key parameters such as surface area (m²), IR total (kWh), IR average per square meter (kWh/m²), and total EG produced:
| Placement | Surface Area (m²) | IR Total (kWh) | IR Average (kWh/m²) | EG Total (kWh/year) |
|---|---|---|---|---|
| PVOT | 364.46 | 51,772.64 | 143.43 | 13,837.65 |
| PVOS | 366.55 | 277,696.45 | 657.85 | 68,740.74 |
where: and correspond to the values for each parameter ( ranging from 1 to 4, representing Surface Area, IR Total, IR Average, and EG Total). refers to the values for PVOT (column 1 in Table 1), and refers to the values for PVOS (column 2 in Table 1). The Equation 1 calculates the percentage difference between and for each parameter, with the resulting values presented in Table 2 and Figure 18, illustrating the relative percentage change between PVOT and PVOS for each specific parameter.
In Table 2, the analysis of percentage differences () between PVOT and PVOS highlights variations in performance across various parameters. The PVOT field area was observed to be 0.57% smaller compared to PVOS. Nonetheless, PVOS demonstrated a notable increase in IR total, IR average, and EG total by 137.14%, 128.40%, and 132.97%, respectively.
| Parameter | Differentiation |
|---|---|
| Surface Area (m²) | 0.57% |
| IR Total (kWh) | 137.14% |
| IR Average (kWh/m²) | 128.40% |
| EG Total (kWh/year) | 132.97% |
3.2. Discussion#
The discussion commences with a comprehensive analysis employing a parametric approach and progresses to a deliberation on selected alternatives grounded in comparative analysis. The subsequent sections detail the outcomes derived from the data analysis of two solar panel placement configurations, specifically PVOT and PVOS.
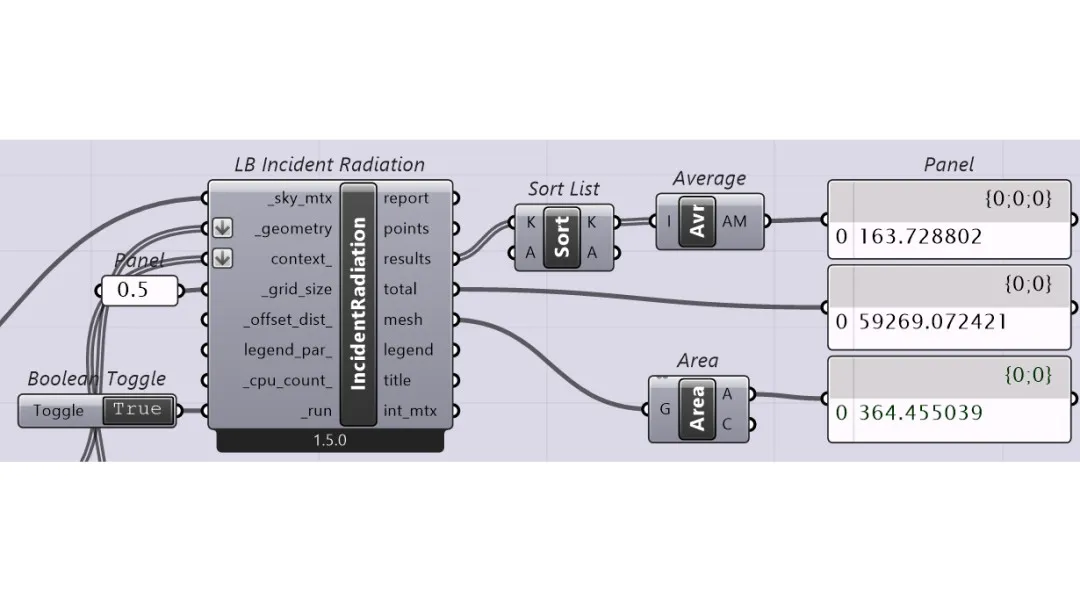
3.2.1. PVOT IR Analysis#
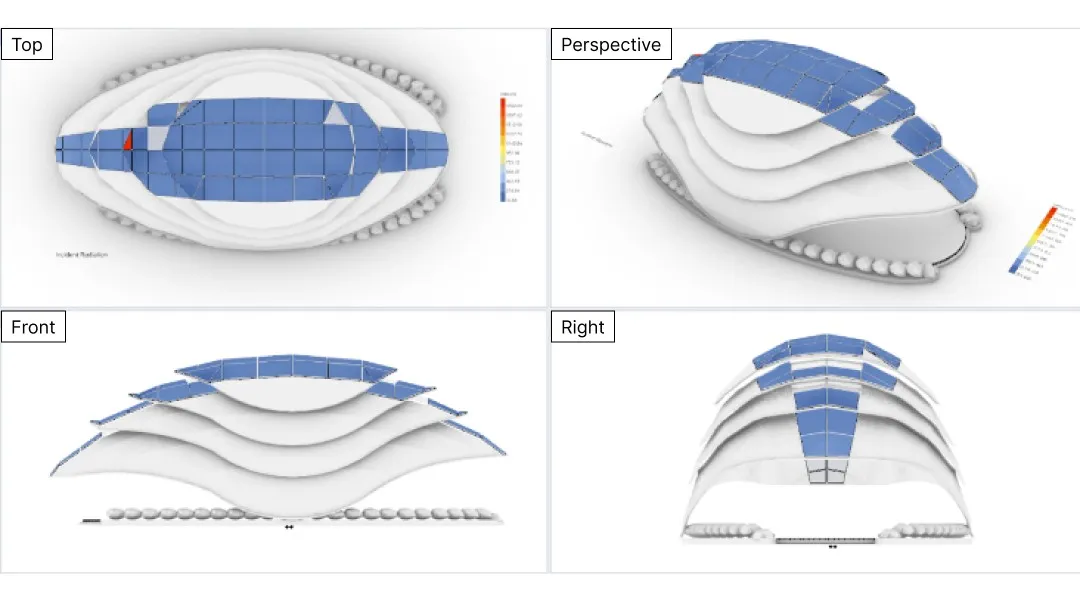
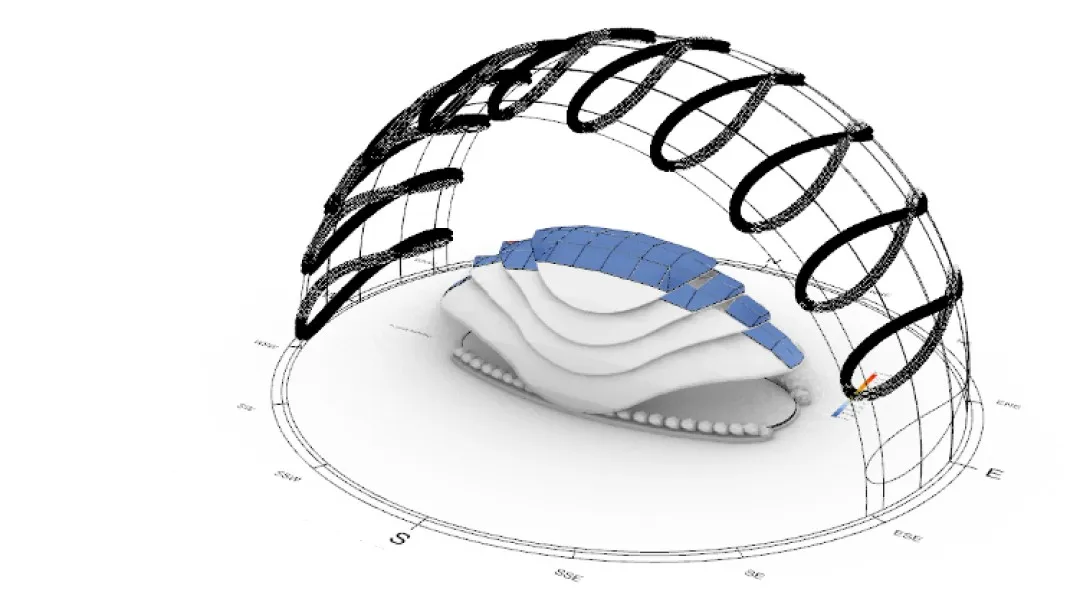
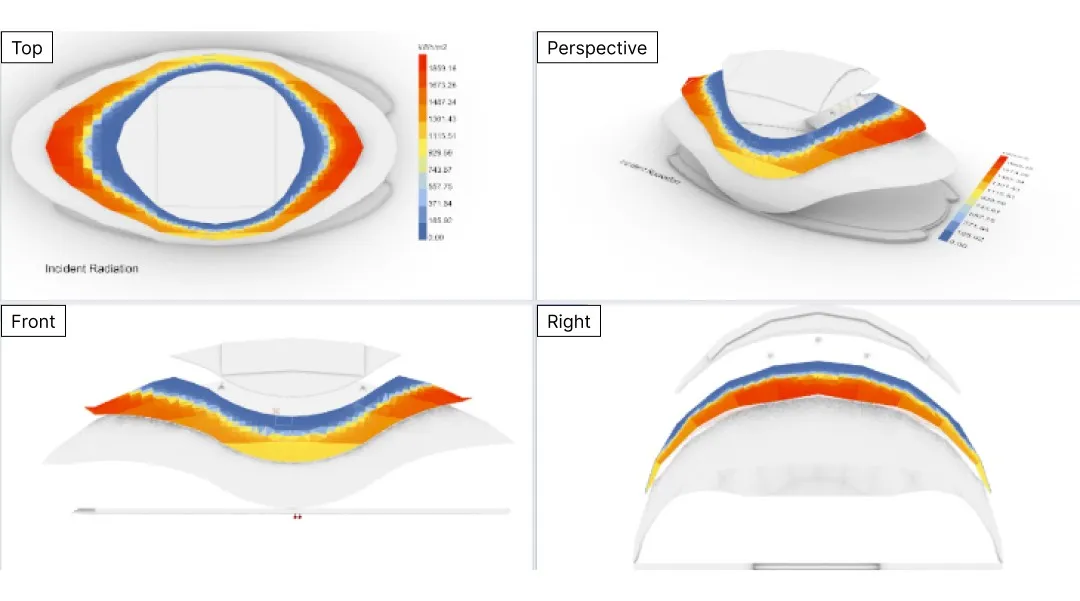
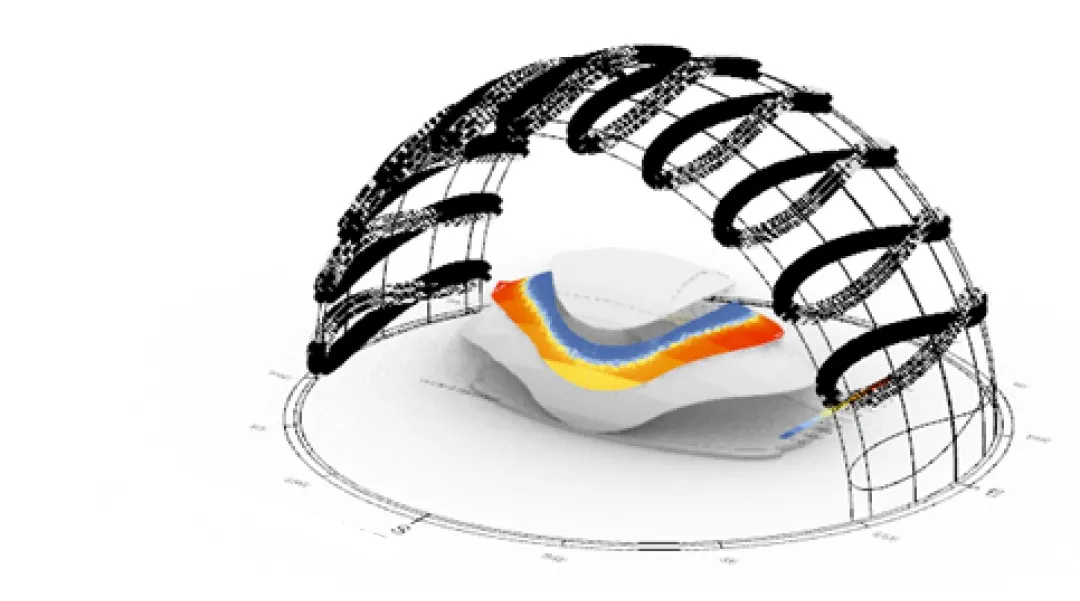
The analysis results reveal that the total IR at PVOT amounted to 59, 269.07 kWh, with an average of 163.73 kWh/m² for an area covering 364.46 m² (see Figure 19). Visual representations of the radiation distribution and solar path over PVOT are presented in Figure 20 and Figure 21. The irradiation simulation results for the PVOT placement indicate a limited potential for PV installation. This observation arises from the predominant blue coloration across all parts of the PV panel, signifying low radiation values received. Consequently, alternative PV placements need to be optimized to enhance the efficiency of energy production, ensuring that the energy generated is more optimal for the number of PV panels installed. This optimization process becomes imperative to maximize the overall effectiveness of the solar energy system.
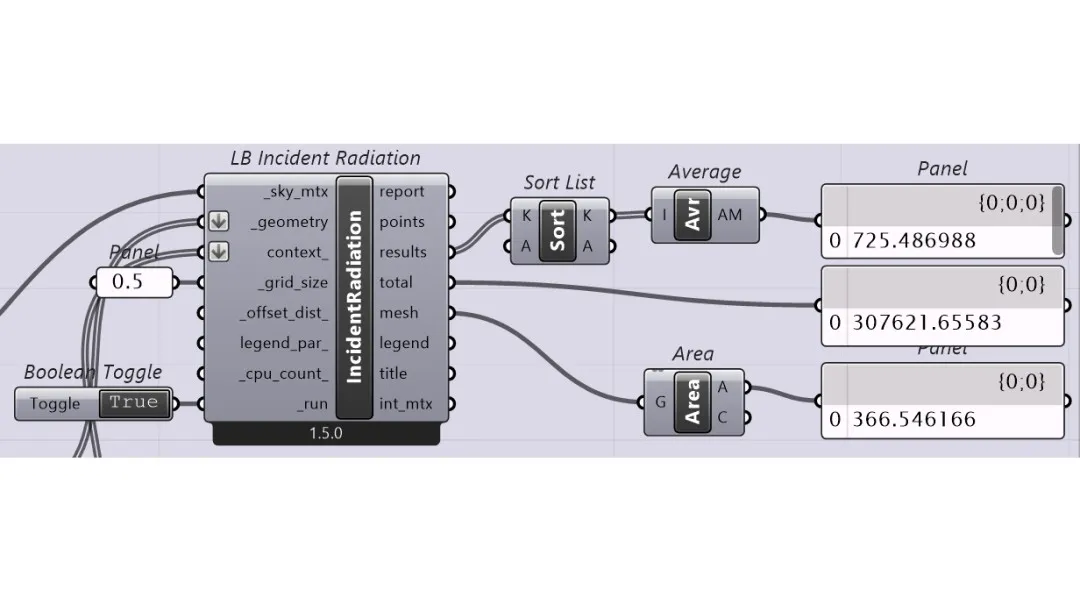
3.2.2. PVOS IR Analysis#
The analysis outcomes indicate that the total IR for PVOS amounted to 30, 621.66 kWh, with an average of 725.49 kWh/m², considering an area of 366.55 m² (see Figure 22). Visual representations of the radiation distribution and solar path on PVOS are presented in Figure 23 and Figure 24.
Upon examination of the irradiation data received by the PV panels, it is observed that the main area of the building roof is visualized in blue, indicating a diminished level of received radiation compared to other PV surface areas. This phenomenon is attributed to the shadow cast by the multi-story roof situated above it. Consequently, it is advisable to refrain from installing PV panels in locations overshadowed by other objects to uphold the effectiveness of the PV system, thereby optimizing the energy production process.
3.2.3. PVOT AC Analysis#
Electrical Energy Generated (EG) measurements reveal performance variations across the PVOT, with EG values ranging from 30.55 kWh to 410.91 kWh per year for each surface. The cumulative EG for electricity production is recorded at 13, 837.65 kWh per year, underscoring the noteworthy potential of the PVOT configuration. Table 3 offers a visual representation of the energy distribution across each PV surface number.
The simulation results indicate that each surface’s maximum electrical EG is 410.91 kWh, while the minimum is 28.09 kWh. Analyzing the color distribution in the heatmap visualization reveals that most of the electrical EG potential falls within the mid-range spectrum (yellow and orange). This suggests that the electrical EG potential from the PVOT surface is not exceptionally high, as most values are concentrated in the moderate range.
| 1 | 298.67 | 13 | 320.15 | 25 | 223.55 | 37 | 33.04 | 49 | 198.52 | 61 | 28.09 |
| 2 | 326.30 | 14 | 326.38 | 26 | 223.60 | 38 | 246.05 | 50 | 281.53 | 62 | 195.03 |
| 3 | 327.35 | 15 | 327.46 | 27 | 157.72 | 39 | 243.09 | 51 | 154.05 | 63 | 198.29 |
| 4 | 322.09 | 16 | 322.19 | 28 | 56.44 | 40 | 30.55 | 52 | 152.09 | 64 | 165.92 |
| 5 | 294.55 | 17 | 128.26 | 29 | 172.08 | 41 | 30.55 | 53 | 60.76 | 65 | 163.19 |
| 6 | 300.29 | 18 | 48.26 | 30 | 206.61 | 42 | 410.91 | 54 | 31.41 | 66 | 88.13 |
| 7 | 301.26 | 19 | 275.79 | 31 | 156.43 | 43 | 405.96 | 55 | 215.93 | 67 | 88.12 |
| 8 | 296.42 | 20 | 275.86 | 32 | 206.71 | 44 | 210.62 | 56 | 233.86 | ||
| 9 | 294.55 | 21 | 48.54 | 33 | 156.50 | 45 | 210.85 | 57 | 230.90 | ||
| 10 | 300.29 | 22 | 294.88 | 34 | 180.50 | 46 | 300.28 | 58 | 208.25 | ||
| 11 | 301.26 | 23 | 293.05 | 35 | 45.46 | 47 | 260.88 | 59 | 210.91 | ||
| 12 | 296.42 | 24 | 156.93 | 36 | 33.04 | 48 | 225.95 | 60 | 28.09 |
3.2.4. PVOS AC Analysis#
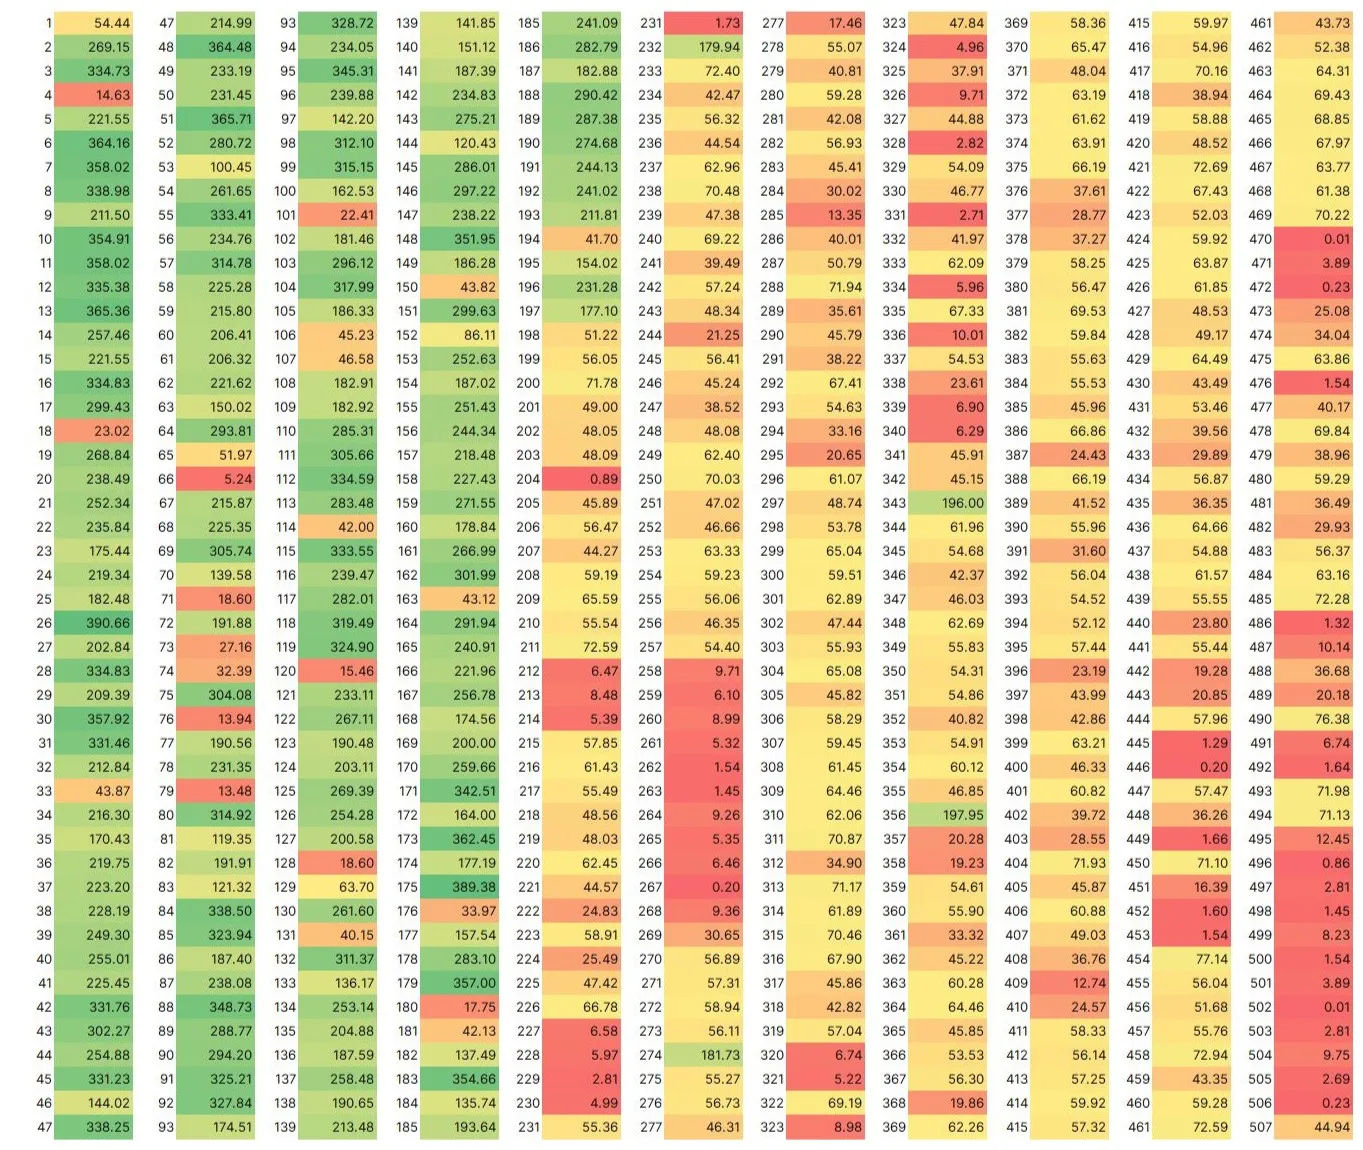
Electrical EG measurements for PVOS exhibit performance variations, with EG values spanning from 0.20 kWh to 391.58 kWh per year for each surface. The collective EG for electricity production across all surfaces attains 68, 740.74 kWh per year, affirming the notable potential of the PVOS configuration. Table 4 offers a visual representation of the energy distribution across each PV.
The heatmap visualization data from the simulation indicates a prevalence of green-yellow areas over orange-red areas. This suggests that the PVOS placement demonstrates greater potential than the PVOT placement. Nevertheless, it is noteworthy that several PV surfaces still have limited potential. Therefore, in the final optimization stage, a careful reconsideration of areas where PV panels should not be installed becomes imperative to enhance the overall effectiveness of the solar energy system – one of the best alternatives to conventional power plants, as mentioned in [98].
| 1 | 54.44 | 47 | 214.99 | 93 | 328.72 | 139 | 141.85 | 185 | 241.09 | 231 | 1.73 | 277 | 17.46 | 323 | 47.84 | 369 | 58.36 | 415 | 59.97 | 461 | 43.73 |
| 2 | 269.15 | 48 | 364.48 | 94 | 234.05 | 140 | 151.12 | 186 | 282.79 | 232 | 179.94 | 278 | 55.07 | 324 | 4.96 | 370 | 65.47 | 416 | 54.96 | 462 | 52.38 |
| 3 | 334.73 | 49 | 233.19 | 95 | 345.31 | 141 | 187.39 | 187 | 182.88 | 233 | 72.40 | 279 | 40.81 | 325 | 37.91 | 371 | 48.04 | 417 | 70.16 | 463 | 64.31 |
| 4 | 14.63 | 50 | 231.45 | 96 | 239.88 | 142 | 234.83 | 188 | 290.42 | 234 | 42.47 | 280 | 59.28 | 326 | 9.71 | 372 | 63.19 | 418 | 38.94 | 464 | 69.43 |
| 5 | 221.55 | 51 | 365.71 | 97 | 142.20 | 143 | 275.21 | 189 | 287.38 | 235 | 56.32 | 281 | 42.08 | 327 | 44.88 | 373 | 61.62 | 419 | 58.88 | 465 | 68.85 |
| 6 | 364.16 | 52 | 280.72 | 98 | 312.10 | 144 | 120.43 | 190 | 274.68 | 236 | 44.54 | 282 | 56.93 | 328 | 2.82 | 374 | 63.91 | 420 | 48.52 | 466 | 67.97 |
| 7 | 358.02 | 53 | 100.45 | 99 | 315.15 | 145 | 286.01 | 191 | 244.13 | 237 | 62.96 | 283 | 45.41 | 329 | 54.09 | 375 | 66.19 | 421 | 72.69 | 467 | 63.77 |
| 8 | 338.98 | 54 | 261.65 | 100 | 162.53 | 146 | 297.22 | 192 | 241.02 | 238 | 70.48 | 284 | 30.02 | 330 | 46.77 | 376 | 37.61 | 422 | 67.43 | 468 | 61.38 |
| 9 | 211.50 | 55 | 333.41 | 101 | 22.41 | 147 | 238.22 | 193 | 211.81 | 239 | 47.38 | 285 | 13.35 | 331 | 2.71 | 377 | 28.77 | 423 | 52.03 | 469 | 70.22 |
| 10 | 354.91 | 56 | 234.76 | 102 | 181.46 | 148 | 351.95 | 194 | 41.70 | 240 | 69.22 | 286 | 40.01 | 332 | 41.97 | 378 | 37.27 | 424 | 59.92 | 470 | 0.01 |
| 11 | 358.02 | 57 | 314.78 | 103 | 296.12 | 149 | 186.28 | 195 | 154.02 | 241 | 39.49 | 287 | 50.79 | 333 | 62.09 | 379 | 58.25 | 425 | 63.87 | 471 | 3.89 |
| 12 | 335.38 | 58 | 225.28 | 104 | 317.99 | 150 | 43.82 | 196 | 231.28 | 242 | 57.24 | 288 | 71.94 | 334 | 5.96 | 380 | 56.47 | 426 | 61.85 | 472 | 0.23 |
| 13 | 365.36 | 59 | 215.80 | 105 | 186.33 | 151 | 299.63 | 197 | 177.10 | 243 | 48.34 | 289 | 35.61 | 335 | 67.33 | 381 | 69.53 | 427 | 48.53 | 473 | 25.08 |
| 14 | 257.46 | 60 | 206.41 | 106 | 45.23 | 152 | 86.11 | 198 | 51.22 | 244 | 21.25 | 290 | 45.79 | 336 | 10.01 | 382 | 59.84 | 428 | 49.17 | 474 | 34.04 |
| 15 | 221.55 | 61 | 206.32 | 107 | 46.58 | 153 | 252.63 | 199 | 56.05 | 245 | 56.41 | 291 | 38.22 | 337 | 54.53 | 383 | 55.63 | 429 | 64.49 | 475 | 63.86 |
| 16 | 334.83 | 62 | 221.62 | 108 | 182.91 | 154 | 187.02 | 200 | 71.78 | 246 | 45.24 | 292 | 67.41 | 338 | 23.61 | 384 | 55.53 | 430 | 43.49 | 476 | 1.54 |
| 17 | 299.43 | 63 | 150.02 | 109 | 182.92 | 155 | 251.43 | 201 | 49.00 | 247 | 38.52 | 293 | 54.63 | 339 | 6.90 | 385 | 45.96 | 431 | 53.46 | 477 | 40.17 |
| 18 | 23.02 | 64 | 293.81 | 110 | 285.31 | 156 | 244.34 | 202 | 48.05 | 248 | 48.08 | 294 | 33.16 | 340 | 6.29 | 386 | 66.86 | 432 | 39.56 | 478 | 69.84 |
| 19 | 268.84 | 65 | 51.97 | 111 | 305.66 | 157 | 218.48 | 203 | 48.09 | 249 | 62.40 | 295 | 20.65 | 341 | 45.91 | 387 | 24.43 | 433 | 29.89 | 479 | 38.96 |
| 20 | 238.49 | 66 | 5.24 | 112 | 334.59 | 158 | 227.43 | 204 | 0.89 | 250 | 70.03 | 296 | 61.07 | 342 | 45.15 | 388 | 66.19 | 434 | 56.87 | 480 | 59.29 |
| 21 | 252.34 | 67 | 215.87 | 113 | 283.48 | 159 | 271.55 | 205 | 45.89 | 251 | 47.02 | 297 | 48.74 | 343 | 196.00 | 389 | 41.52 | 435 | 36.35 | 481 | 36.49 |
| 22 | 235.84 | 68 | 225.35 | 114 | 42.00 | 160 | 178.84 | 206 | 56.47 | 252 | 46.66 | 298 | 53.78 | 344 | 61.96 | 390 | 55.96 | 436 | 64.66 | 482 | 29.93 |
| 23 | 175.44 | 69 | 305.74 | 115 | 333.55 | 161 | 266.99 | 207 | 44.27 | 253 | 63.33 | 299 | 65.04 | 345 | 54.68 | 391 | 31.60 | 437 | 54.88 | 483 | 56.37 |
| 24 | 219.34 | 70 | 139.58 | 116 | 239.47 | 162 | 301.99 | 208 | 59.19 | 254 | 59.23 | 300 | 59.51 | 346 | 42.37 | 392 | 56.04 | 438 | 61.57 | 484 | 63.16 |
| 25 | 182.48 | 71 | 18.60 | 117 | 282.01 | 163 | 43.12 | 209 | 65.59 | 255 | 56.06 | 301 | 62.89 | 347 | 46.03 | 393 | 54.52 | 439 | 55.55 | 485 | 72.28 |
| 26 | 390.66 | 72 | 191.88 | 118 | 319.49 | 164 | 291.94 | 210 | 55.54 | 256 | 46.35 | 302 | 47.44 | 348 | 62.69 | 394 | 52.12 | 440 | 23.80 | 486 | 1.32 |
| 27 | 202.84 | 73 | 27.16 | 119 | 324.90 | 165 | 240.91 | 211 | 72.59 | 257 | 54.40 | 303 | 55.93 | 349 | 55.83 | 395 | 57.44 | 441 | 55.44 | 487 | 10.14 |
| 28 | 334.83 | 74 | 32.39 | 120 | 15.46 | 166 | 221.96 | 212 | 6.47 | 258 | 9.71 | 304 | 65.08 | 350 | 54.31 | 396 | 23.19 | 442 | 19.28 | 488 | 36.68 |
| 29 | 209.39 | 75 | 304.08 | 121 | 233.11 | 167 | 256.78 | 213 | 8.48 | 259 | 6.10 | 305 | 45.82 | 351 | 54.86 | 397 | 43.99 | 443 | 20.85 | 489 | 20.18 |
| 30 | 357.92 | 76 | 13.94 | 122 | 267.11 | 168 | 174.56 | 214 | 5.39 | 260 | 8.99 | 306 | 58.29 | 352 | 40.82 | 398 | 42.86 | 444 | 57.96 | 490 | 76.38 |
| 31 | 331.46 | 77 | 190.56 | 123 | 190.48 | 169 | 200.00 | 215 | 57.85 | 261 | 5.32 | 307 | 59.45 | 353 | 54.91 | 399 | 63.21 | 445 | 1.29 | 491 | 6.74 |
| 32 | 212.84 | 78 | 231.35 | 124 | 203.11 | 170 | 259.66 | 216 | 61.43 | 262 | 1.54 | 308 | 61.45 | 354 | 60.12 | 400 | 46.33 | 446 | 0.20 | 492 | 1.64 |
| 33 | 43.87 | 79 | 13.48 | 125 | 269.39 | 171 | 342.51 | 217 | 55.49 | 263 | 1.45 | 309 | 64.46 | 355 | 46.85 | 401 | 60.82 | 447 | 57.47 | 493 | 71.98 |
| 34 | 216.30 | 80 | 314.92 | 126 | 254.28 | 172 | 164.00 | 218 | 48.56 | 264 | 9.26 | 310 | 62.06 | 356 | 197.95 | 402 | 39.72 | 448 | 36.26 | 494 | 71.13 |
| 35 | 170.43 | 81 | 119.35 | 127 | 200.58 | 173 | 362.45 | 219 | 48.03 | 265 | 5.35 | 311 | 70.87 | 357 | 20.28 | 403 | 28.55 | 449 | 1.66 | 495 | 12.45 |
| 36 | 219.75 | 82 | 191.91 | 128 | 18.60 | 174 | 177.19 | 220 | 62.45 | 266 | 6.46 | 312 | 34.90 | 358 | 19.23 | 404 | 71.93 | 450 | 71.10 | 496 | 0.86 |
| 37 | 223.20 | 83 | 121.32 | 129 | 63.70 | 175 | 389.38 | 221 | 44.57 | 267 | 0.20 | 313 | 71.17 | 359 | 54.61 | 405 | 45.87 | 451 | 16.39 | 497 | 2.81 |
| 38 | 228.19 | 84 | 338.50 | 130 | 261.60 | 176 | 33.97 | 222 | 24.83 | 268 | 9.36 | 314 | 61.89 | 360 | 55.90 | 406 | 60.88 | 452 | 1.60 | 498 | 1.45 |
| 39 | 249.30 | 85 | 323.94 | 131 | 40.15 | 177 | 157.54 | 223 | 58.91 | 269 | 30.65 | 315 | 70.46 | 361 | 33.32 | 407 | 49.03 | 453 | 1.54 | 499 | 8.23 |
| 40 | 255.01 | 86 | 187.40 | 132 | 311.37 | 178 | 283.10 | 224 | 25.49 | 270 | 56.89 | 316 | 67.90 | 362 | 45.22 | 408 | 36.76 | 454 | 77.14 | 500 | 1.54 |
| 41 | 225.45 | 87 | 238.08 | 133 | 136.17 | 179 | 357.00 | 225 | 47.42 | 271 | 57.31 | 317 | 45.86 | 363 | 60.28 | 409 | 12.74 | 455 | 56.04 | 501 | 3.89 |
| 42 | 331.76 | 88 | 348.73 | 134 | 253.14 | 180 | 17.75 | 226 | 66.78 | 272 | 58.94 | 318 | 42.82 | 364 | 64.46 | 410 | 24.57 | 456 | 51.68 | 502 | 0.01 |
| 43 | 302.27 | 89 | 288.77 | 135 | 204.88 | 181 | 42.13 | 227 | 6.58 | 273 | 56.11 | 319 | 57.04 | 365 | 45.85 | 411 | 58.33 | 457 | 55.76 | 503 | 2.81 |
| 44 | 254.88 | 90 | 294.20 | 136 | 187.59 | 182 | 137.49 | 228 | 5.97 | 274 | 181.73 | 320 | 6.74 | 366 | 53.53 | 412 | 56.14 | 458 | 72.94 | 504 | 9.75 |
| 45 | 331.23 | 91 | 325.21 | 137 | 258.48 | 183 | 354.66 | 229 | 2.81 | 275 | 55.27 | 321 | 5.22 | 367 | 56.30 | 413 | 57.25 | 459 | 43.35 | 505 | 2.69 |
| 46 | 144.02 | 92 | 327.84 | 138 | 190.65 | 184 | 135.74 | 230 | 4.99 | 276 | 56.73 | 322 | 69.19 | 368 | 19.86 | 414 | 59.92 | 460 | 59.28 | 506 | 0.23 |
| 47 | 338.25 | 93 | 174.51 | 139 | 213.48 | 185 | 193.64 | 231 | 55.36 | 277 | 46.31 | 323 | 8.98 | 369 | 62.26 | 415 | 57.32 | 461 | 72.59 | 507 | 44.94 |
Based on simulation results, it was found that the placement of PV panels on the side roof shell has more potential than placing PV panels on the top of the roof transversely following the sun’s path (east-west). This is because even though PV panels are placed directly following the sun’s path, it is not necessarily that the area receives more annual solar radiation compared to its side. As demonstrated by the testing conducted by Matius et al. (2021) [99] in the case of installing PV panels at the eco-tourism center of Liogu Ku Silou-Silou (EPLISSI), Sabah, Malaysia, which has weather and climatic conditions like the research project location in Medan, Indonesia, the research results indicate that the optimal PV panel installation is facing south, as the PV panel installation location is not perpendicular to the sun’s path but inclined towards the south.
4. Conclusion#
BIPV design optimization has been conducted for two alternative PV placements: PVOT and PVOS. An analysis of the PVOT placement reveals that it has not yielded significant energy production due to the low received radiation compared to PVOS placement, leading to the determination that PVOT placement is inappropriate. A comparative assessment of both simulations underscores that PVOS exhibits more significant potential in harnessing solar radiation, mainly when situated adjacent to buildings. This conclusion is drawn from simulation results utilizing radiation data received on the surface of the building roof.
The disparity in EG between PVOT and PVOS is substantial, with PVOT producing an annual EG of 13, 837.65 kWh, while PVOS achieves a significantly higher output of 68, 740.74 kWh per year. Several factors contribute to this difference, including the slightly smaller field area of PVOT (0.57% less than PVOS). Despite this, the contrast in electric EG potential between the two placements remains significant. Additionally, the sun’s annual path (sun path) and varying radiation levels at various times influence these outcomes. In architectural design, decisions concerning solar panel placement should carefully consider solar radiation potential and align with desired energy performance objectives.
Acknowledgment#
This paper constitutes a component of ongoing research conducted at the Institut Teknologi Bandung (ITB), New and Renewable Energy Research Center. The center is steadfastly committed to actively contributing to reducing carbon emissions by advocating substituting fossil energy with cleaner alternatives. Support for this specific phase of the research has been provided through the Collaboration Program of the Ministry of Education, Culture, Research, and Technology of the Republic of Indonesia in collaboration with ITB, Universitas Gadjah Mada, and Universitas Sumatera Utara. Grant numbers: “PN.6.11.2023” Kemendikbudristek RI and “LPPM.PN-6-13-2023” ITB.
References#
- W. Zhong, T. Schröder, and J. Bekkering, “Biophilic design in architecture and its contributions to health, well-being, and sustainability: A critical review,” Front. Archit. Res., vol. 11, no. 1, pp. 114–141, Feb. 2022, doi: 10.1016/j.foar.2021.07.006. ⌃ ⌃2
- U. Ali, M. H. Shamsi, C. Hoare, E. Mangina, and J. O’Donnell, “Review of urban building energy modeling (UBEM) approaches, methods and tools using qualitative and quantitative analysis,” Energy Build., vol. 246, p. 111073, Sep. 2021, doi: 10.1016/j.enbuild.2021.111073. ⌃
- International Energy Agency, “Key World Energy Statistics 2020,” Paris, 2020. Accessed: Jun. 07, 2024. [Online]. Available: https://www.iea.org/reports/key-world-energy-statistics-2020 ⌃
- Deloitte Research Center for Energy & Industrials, “2024 Engineering and Construction Industry Outlook,” Deloitte Insight, 2023, Accessed: Aug. 22, 2024. [Online]. Available: https://www2.deloitte.com/us/en/insights/industry/engineering-and-construction/engineering-and-construction-industry-outlook.html ⌃
- Deloitte Center for Financial Services, “2024 Commercial Real Estate Outlook,” Deloitte Insight, 2023, Accessed: Aug. 22, 2024. [Online]. Available: https://www2.deloitte.com/us/en/insights/industry/financial-services/commercial-real-estate-outlook.html ⌃
- ScienceDirect, “National Energy Policy - an overview | ScienceDirect Topics,” ScienceDirect, 2024, Accessed: Aug. 22, 2024. [Online]. Available: https://www.sciencedirect.com/topics/social-sciences/national-energy-policy ⌃
- Y. Li, Y. Mao, W. Wang, and N. Wu, “Net-Zero Energy Consumption Building in China: An Overview of Building-Integrated Photovoltaic Case and Initiative toward Sustainable Future Development,” Buildings, vol. 13, no. 8, p. 2024, Aug. 2023, doi: 10.3390/buildings13082024. ⌃
- M. Farghali et al., “Strategies to save energy in the context of the energy crisis: a review,” Environ. Chem. Lett., vol. 21, no. 4, pp. 2003–2039, Aug. 2023, doi: 10.1007/s10311-023-01591-5. ⌃
- S. R. S. Aldhshan, K. N. Abdul Maulud, W. S. Wan Mohd Jaafar, O. A. Karim, and B. Pradhan, “Energy Consumption and Spatial Assessment of Renewable Energy Penetration and Building Energy Efficiency in Malaysia: A Review,” Sustainability, vol. 13, no. 16, p. 9244, Aug. 2021, doi: 10.3390/su13169244. ⌃
- D. Dahiya and B. Laishram, “Life cycle energy analysis of buildings: A systematic review,” Build. Environ., vol. 252, p. 111160, Mar. 2024, doi: 10.1016/j.buildenv.2024.111160. ⌃
- P. Mêda, D. Calvetti, E. Hjelseth, and H. Sousa, “Incremental Digital Twin Conceptualisations Targeting Data-Driven Circular Construction,” Buildings, vol. 11, no. 11, p. 554, Nov. 2021, doi: 10.3390/buildings11110554. ⌃
- H. Karimi, M. A. Adibhesami, H. Bazazzadeh, and S. Movafagh, “Green Buildings: Human-Centered and Energy Efficiency Optimization Strategies,” Energies, vol. 16, no. 9, p. 3681, Apr. 2023, doi: 10.3390/en16093681. ⌃
- Y. Zhu and Y. Hu, “The Correlation between Urban Form and Carbon Emissions: A Bibliometric and Literature Review,” Sustainability, vol. 15, no. 18, p. 13439, Sep. 2023, doi: 10.3390/su151813439. ⌃
- O. Hamilton, I., and Rapf, “Executive summary of the 2020 global status report for buildings and construction, Global Alliance for Buildings and Construction,” 2021. [Online]. Available: https://wedocs.unep.org/bitstream/handle/20.500.11822/34572/GSR_ES.pdf?sequence=3&isAllowed=y. ⌃
- M. Bonomolo, U. Jakob, D. Neyer, M. Strobel, and S. Vasta, “Integration of Solar Cooling Systems in Buildings in Sunbelt Region: An Overview,” Buildings, vol. 13, no. 9, p. 2169, Aug. 2023, doi: 10.3390/buildings13092169. ⌃
- A. Adel, “Unlocking the Future: Fostering Human–Machine Collaboration and Driving Intelligent Automation through Industry 5.0 in Smart Cities,” Smart Cities, vol. 6, no. 5, pp. 2742–2782, Oct. 2023, doi: 10.3390/smartcities6050124. ⌃
- M. Amiri, M. Hashemi-Tabatabaei, M. Ghahremanloo, M. Keshavarz-Ghorabaee, E. K. Zavadskas, and A. Kaklauskas, “Evaluating Life Cycle of Buildings Using an Integrated Approach Based on Quantitative-Qualitative and Simplified Best-Worst Methods (QQM-SBWM),” Sustainability, vol. 13, no. 8, p. 4487, Apr. 2021, doi: 10.3390/su13084487. ⌃
- N. Kafa, A. Jaegler, and J. Sarkis, “Harnessing Corporate Sustainability Decision-Making Complexity: A Field Study of Complementary Approaches,” Sustainability, vol. 12, no. 24, p. 10584, Dec. 2020, doi: 10.3390/su122410584. ⌃
- Z. Yang and Z. Xiao, “A Review of the Sustainable Development of Solar Photovoltaic Tracking System Technology,” Energies, vol. 16, no. 23, p. 7768, Nov. 2023, doi: 10.3390/en16237768. ⌃
- S. Gupta et al., “Estimation of Solar Radiation with Consideration of Terrestrial Losses at a Selected Location—A Review,” Sustainability, vol. 15, no. 13, p. 9962, Jun. 2023, doi: 10.3390/su15139962. ⌃
- M. Makkiabadi et al., “Performance Evaluation of Solar Power Plants: A Review and a Case Study,” Processes, vol. 9, no. 12, p. 2253, Dec. 2021, doi: 10.3390/pr9122253. ⌃ ⌃2
- IESR, “Indonesia Clean Energy Outlook: Tracking Progress and Review of Clean Energy Development in Indonesia,” Jakarta, 2019. [Online]. Available: www.iesr.or.id ⌃
- G. Kumar Dalapati et al., “Maximizing solar energy production in ASEAN region: Opportunity and challenges,” Results Eng., vol. 20, p. 101525, Dec. 2023, doi: 10.1016/j.rineng.2023.101525. ⌃
- A. K. Shukla, K. Sudhakar, P. Baredar, and R. Mamat, “BIPV in Southeast Asian countries – opportunities and challenges,” Renew. Energy Focus, vol. 21, pp. 25–32, Oct. 2017, doi: 10.1016/j.ref.2017.07.001. ⌃ ⌃2 ⌃3
- N. A. Pambudi et al., “Renewable Energy in Indonesia: Current Status, Potential, and Future Development,” Sustainability, vol. 15, no. 3, p. 2342, Jan. 2023, doi: 10.3390/su15032342. ⌃ ⌃2 ⌃3
- A. Ghazali, E. I. Salleh, L. C. Haw, S. Mat, and K. Sopian, “Feasibility of vertical photovoltaic system on high-rise building in Malaysia: performance evaluation,” Int. J. Low-Carbon Technol., vol. 12, no. 3, pp. 263–271, Sep. 2017, doi: 10.1093/ijlct/ctw025. ⌃
- A. K. Pandey et al., “Solar Energy Utilization Techniques, Policies, Potentials, Progresses, Challenges and Recommendations in ASEAN Countries,” Sustainability, vol. 14, no. 18, p. 11193, Sep. 2022, doi: 10.3390/su141811193. ⌃ ⌃2
- H. Damayanti, F. Tumiwa, and M. Citraningrum, “Residential Rooftop Solar: Technical and Market Potential in 34 Provinces in Indonesia,” Jakarta, 2019. ⌃
- N. Papadakis and D. A. Katsaprakakis, “A Review of Energy Efficiency Interventions in Public Buildings,” Energies, vol. 16, no. 17, p. 6329, Aug. 2023, doi: 10.3390/en16176329. ⌃
- D. A. Chwieduk, “Towards modern options of energy conservation in buildings,” Renew. Energy, vol. 101, pp. 1194–1202, Feb. 2017, doi: 10.1016/j.renene.2016.09.061. ⌃
- I. Nuñez, E. E. Cano, E. Cruz, and C. Rovetto, “Designing a Comprehensive and Flexible Architecture to Improve Energy Efficiency and Decision-Making in Managing Energy Consumption and Production in Panama,” Appl. Sci., vol. 13, no. 9, p. 5707, May 2023, doi: 10.3390/app13095707. ⌃
- D. Jordan, T. Barnes, N. Haegel, and I. Repins, “Build solar-energy systems to last — save billions,” Nature, vol. 600, no. 7888, pp. 215–217, Dec. 2021, doi: 10.1038/d41586-021-03626-9. ⌃
- H. M. Maghrabie et al., “State-of-the-Art Technologies for Building-Integrated Photovoltaic Systems,” Buildings, vol. 11, no. 9, p. 383, Aug. 2021, doi: 10.3390/buildings11090383. ⌃ ⌃2 ⌃3
- P. Heinstein, C. Ballif, and L.-E. Perret-Aebi, “Building Integrated Photovoltaics (BIPV): Review, Potentials, Barriers and Myths,” Green, vol. 3, no. 2, Jan. 2013, doi: 10.1515/green-2013-0020. ⌃ ⌃2
- W. Wang, H. Yang, and C. Xiang, “Green roofs and facades with integrated photovoltaic system for zero energy eco-friendly building – A review,” Sustain. Energy Technol. Assessments, vol. 60, p. 103426, Dec. 2023, doi: 10.1016/j.seta.2023.103426. ⌃
- R. Khalifeeh, H. Alrashidi, N. Sellami, T. Mallick, and W. Issa, “State-of-the-Art Review on the Energy Performance of Semi-Transparent Building Integrated Photovoltaic across a Range of Different Climatic and Environmental Conditions,” Energies, vol. 14, no. 12, p. 3412, Jun. 2021, doi: 10.3390/en14123412. ⌃
- E. Oudot, K. Gholmane, D. A. H. Fakra, and R. Benelmir, “Energetic Valorization of the Innovative Building Envelope: An Overview of Electric Production System Optimization,” Sustainability, vol. 16, no. 6, p. 2305, Mar. 2024, doi: 10.3390/su16062305. ⌃
- S. Ghosh and R. Yadav, “Future of photovoltaic technologies: A comprehensive review,” Sustain. Energy Technol. Assessments, vol. 47, p. 101410, Oct. 2021, doi: 10.1016/j.seta.2021.101410. ⌃ ⌃2
- A. Machín and F. Márquez, “Advancements in Photovoltaic Cell Materials: Silicon, Organic, and Perovskite Solar Cells,” Materials (Basel)., vol. 17, no. 5, p. 1165, Mar. 2024, doi: 10.3390/ma17051165. ⌃
- R. Dallaev, T. Pisarenko, N. Papež, and V. Holcman, “Overview of the Current State of Flexible Solar Panels and Photovoltaic Materials,” Materials (Basel)., vol. 16, no. 17, p. 5839, Aug. 2023, doi: 10.3390/ma16175839. ⌃
- S. Khan, K. Sudhakar, M. Hazwan Yusof, and S. Sundaram, “Review of Building Integrated Photovoltaics System for Electric Vehicle Charging,” Chem. Rec., vol. 24, no. 3, Mar. 2024, doi: 10.1002/tcr.202300308. ⌃
- V. J. Reddy, N. P. Hariram, M. F. Ghazali, and S. Kumarasamy, “Pathway to Sustainability: An Overview of Renewable Energy Integration in Building Systems,” Sustainability, vol. 16, no. 2, p. 638, Jan. 2024, doi: 10.3390/su16020638. ⌃
- L. M. Shaker, A. A. Al-Amiery, M. M. Hanoon, W. K. Al-Azzawi, and A. A. H. Kadhum, “Examining the influence of thermal effects on solar cells: a comprehensive review,” Sustain. Energy Res., vol. 11, no. 1, p. 6, Feb. 2024, doi: 10.1186/s40807-024-00100-8. ⌃
- L. Gunarathna, “Opportunities for blockchain application in distributed solar energy (DSE) projects,” RMIT University, 2022. [Online]. Available: https://researchrepository.rmit.edu.au/esploro/outputs/doctoral/Opportunities-for-blockchain-application-in-distributed/9922207012801341 ⌃
- D. D. Furszyfer Del Rio et al., “Decarbonizing the glass industry: A critical and systematic review of developments, sociotechnical systems and policy options,” Renew. Sustain. Energy Rev., vol. 155, p. 111885, Mar. 2022, doi: 10.1016/j.rser.2021.111885. ⌃
- D. S. Vijayan et al., “Advancements in Solar Panel Technology in Civil Engineering for Revolutionizing Renewable Energy Solutions—A Review,” Energies, vol. 16, no. 18, p. 6579, Sep. 2023, doi: 10.3390/en16186579. ⌃
- U. G. D. Madushika and W. Lu, “Green retrofitting application in developing economies: State of the art and future research directions,” Energy Build., vol. 301, p. 113712, Dec. 2023, doi: 10.1016/j.enbuild.2023.113712. ⌃
- H. Lan, Z. Gou, and Y. Lu, “Machine learning approach to understand regional disparity of residential solar adoption in Australia,” Renew. Sustain. Energy Rev., vol. 136, p. 110458, Feb. 2021, doi: 10.1016/j.rser.2020.110458. ⌃
- Agency for the Assessment and Application of Technology, Outlook Energi Indonesia 2021 Perspektif Teknologi Energi Indonesia: Tenaga Surya untuk Penyediaan Energi Charging Station. 2021. ⌃ ⌃2
- V. Kapsalis et al., “Bottom-up energy transition through rooftop PV upscaling: Remaining issues and emerging upgrades towards NZEBs at different climatic conditions,” Renew. Sustain. Energy Transit., vol. 5, p. 100083, Aug. 2024, doi: 10.1016/j.rset.2024.100083. ⌃
- V. Kapsalis et al., “Critical assessment of large-scale rooftop photovoltaics deployment in the global urban environment,” Renew. Sustain. Energy Rev., vol. 189, p. 114005, Jan. 2024, doi: 10.1016/j.rser.2023.114005. ⌃
- G. Asefi, A. Habibollahzade, T. Ma, E. Houshfar, and R. Wang, “Thermal management of building-integrated photovoltaic/thermal systems: A comprehensive review,” Sol. Energy, vol. 216, pp. 188–210, Mar. 2021, doi: 10.1016/j.solener.2021.01.005. ⌃
- O. Arriaga Arruti, A. Virtuani, and C. Ballif, “Long‐term performance and reliability of silicon heterojunction solar modules,” Prog. Photovoltaics Res. Appl., vol. 31, no. 7, pp. 664–677, Jul. 2023, doi: 10.1002/pip.3688. ⌃
- T. Wilberforce, A. G. Olabi, E. T. Sayed, K. Elsaid, H. M. Maghrabie, and M. A. Abdelkareem, “A review on zero energy buildings – Pros and cons,” Energy Built Environ., vol. 4, no. 1, pp. 25–38, Feb. 2023, doi: 10.1016/j.enbenv.2021.06.002. ⌃
- S. Constantinou, F. Al‐naemi, H. Alrashidi, T. Mallick, and W. Issa, “A review on technological and urban sustainability perspectives of advanced building‐integrated photovoltaics,” Energy Sci. Eng., vol. 12, no. 3, pp. 1265–1293, Mar. 2024, doi: 10.1002/ese3.1639. ⌃
- T. Vroon, E. Teunissen, M. Drent, S. O. Negro, and W. G. J. H. M. van Sark, “Escaping the niche market: An innovation system analysis of the Dutch building integrated photovoltaics (BIPV) sector,” Renew. Sustain. Energy Rev., vol. 155, p. 111912, Mar. 2022, doi: 10.1016/j.rser.2021.111912. ⌃
- C. Vassiliades et al., “Building integration of active solar energy systems: A review of geometrical and architectural characteristics,” Renew. Sustain. Energy Rev., vol. 164, p. 112482, Aug. 2022, doi: 10.1016/j.rser.2022.112482. ⌃
- J. Fernandes, M. C. Santos, and R. Castro, “Introductory Review of Energy Efficiency in Buildings Retrofits,” Energies, vol. 14, no. 23, p. 8100, Dec. 2021, doi: 10.3390/en14238100. ⌃
- Y. Li, Y. Zhao, Y. Chi, Y. Hong, and J. Yin, “Shape-morphing materials and structures for energy-efficient building envelopes,” Mater. Today Energy, vol. 22, p. 100874, Dec. 2021, doi: 10.1016/j.mtener.2021.100874. ⌃
- I. Kistelegdi, K. R. Horváth, T. Storcz, and Z. Ercsey, “Building Geometry as a Variable in Energy, Comfort, and Environmental Design Optimization—A Review from the Perspective of Architects,” Buildings, vol. 12, no. 1, p. 69, Jan. 2022, doi: 10.3390/buildings12010069. ⌃
- N. Bushra, “A comprehensive analysis of parametric design approaches for solar integration with buildings: A literature review,” Renew. Sustain. Energy Rev., vol. 168, p. 112849, Oct. 2022, doi: 10.1016/j.rser.2022.112849. ⌃
- F. Frontini, P. Bonomo, D. Moser, and L. Maturi, “Building integrated photovoltaic facades: challenges, opportunities and innovations,” in Rethinking Building Skins, Elsevier, 2022, pp. 201–229. doi: 10.1016/B978-0-12-822477-9.00012-7. ⌃
- N. Skandalos and D. Karamanis, “An optimization approach to photovoltaic building integration towards low energy buildings in different climate zones,” Appl. Energy, vol. 295, p. 117017, Aug. 2021, doi: 10.1016/j.apenergy.2021.117017. ⌃
- A. Taşer, B. K. Koyunbaba, and T. Kazanasmaz, “Thermal, daylight, and energy potential of building-integrated photovoltaic (BIPV) systems: A comprehensive review of effects and developments,” Sol. Energy, vol. 251, pp. 171–196, Feb. 2023, doi: 10.1016/j.solener.2022.12.039. ⌃
- F. Vahdatikhaki, N. Salimzadeh, and A. Hammad, “Optimization of PV modules layout on high-rise building skins using a BIM-based generative design approach,” Energy Build., vol. 258, p. 111787, Mar. 2022, doi: 10.1016/j.enbuild.2021.111787. ⌃
- B. Tian, “A LiDAR DSM based geometry modelling method to improve solar irradiance simulation and PV yield prediction in urban environments,” Eindhoven University of Technology, 2021. ⌃
- N. Rane, S. Choudhary, and J. Rane, “Leading-edge technologies for architectural design: a comprehensive review,” SSRN Electron. J., 2023, doi: 10.2139/ssrn.4637891. ⌃ ⌃2
- N. Gu, R. Yu, and P. A. Behbahani, “Parametric Design: Theoretical Development and Algorithmic Foundation for Design Generation in Architecture,” in Handbook of the Mathematics of the Arts and Sciences, Cham: Springer International Publishing, 2021, pp. 1361–1383. doi: 10.1007/978-3-319-57072-3_8. ⌃
- S. Yazdi Bahri, M. Alier Forment, A. Sanchez Riera, F. Bagheri Moghaddam, M. J. Casañ Guerrero, and A. M. Llorens Garcia, “A literature review on thermal comfort performance of parametric façades,” Energy Reports, vol. 8, pp. 120–128, Dec. 2022, doi: 10.1016/j.egyr.2022.10.245. ⌃
- M. L. Castro Pena, A. Carballal, N. Rodríguez-Fernández, I. Santos, and J. Romero, “Artificial intelligence applied to conceptual design. A review of its use in architecture,” Autom. Constr., vol. 124, p. 103550, Apr. 2021, doi: 10.1016/j.autcon.2021.103550. ⌃
- K. Sawatmongkhonkul, E. Joneurairatana, and V. Sirivesmas, “Exploring Parametric Concepts and Principles for Furniture and Interior Design,” Interiority, vol. 7, no. 1, Jan. 2024, doi: 10.7454/in.v7i1.311. ⌃
- A. Badzlin and A. Indraprastha, “A light of Play: Demystifying Daylight-driven Spatial Sensation Modeling through Image-based Analysis,” IOP Conf. Ser. Earth Environ. Sci., vol. 764, no. 1, p. 012009, May 2021, doi: 10.1088/1755-1315/764/1/012009. ⌃
- R. Shan and L. Junghans, “Multi-Objective Optimization for High-Performance Building Facade Design: A Systematic Literature Review,” Sustainability, vol. 15, no. 21, p. 15596, Nov. 2023, doi: 10.3390/su152115596. ⌃
- S. Jiang, M. Wang, and L. Ma, “Gaps and requirements for applying automatic architectural design to building renovation,” Autom. Constr., vol. 147, p. 104742, Mar. 2023, doi: 10.1016/j.autcon.2023.104742. ⌃
- N. Martín-Chivelet et al., “Building-Integrated Photovoltaic (BIPV) products and systems: A review of energy-related behavior,” Energy Build., vol. 262, p. 111998, May 2022, doi: 10.1016/j.enbuild.2022.111998. ⌃
- H. E. Rababah, A. Ghazali, and M. H. Mohd Isa, “Building Integrated Photovoltaic (BIPV) in Southeast Asian Countries: Review of Effects and Challenges,” Sustainability, vol. 13, no. 23, p. 12952, Nov. 2021, doi: 10.3390/su132312952. ⌃
- S. Quintana, P. Huang, P. Saini, and X. Zhang, “A preliminary techno-economic study of a building integrated photovoltaic (BIPV) system for a residential building cluster in Sweden by the integrated toolkit of BIM and PVSITES,” Intell. Build. Int., vol. 13, no. 1, pp. 51–69, Jan. 2021, doi: 10.1080/17508975.2020.1765134. ⌃
- M. Psillaki et al., “Hospitals’ Energy Efficiency in the Perspective of Saving Resources and Providing Quality Services through Technological Options: A Systematic Literature Review,” Energies, vol. 16, no. 2, p. 755, Jan. 2023, doi: 10.3390/en16020755. ⌃
- M. Gopal, H. G. Lemu, and E. M. Gutema, “Sustainable Additive Manufacturing and Environmental Implications: Literature Review,” Sustainability, vol. 15, no. 1, p. 504, Dec. 2022, doi: 10.3390/su15010504. ⌃
- L. Jiang, S. Cui, P. Sun, Y. Wang, and C. Yang, “Comparison of Monocrystalline and Polycrystalline Solar Modules,” in 2020 IEEE 5th Information Technology and Mechatronics Engineering Conference (ITOEC), IEEE, Jun. 2020, pp. 341–344. doi: 10.1109/ITOEC49072.2020.9141722. ⌃
- Ladybug Tools, “Incident Radiation | Ladybug Primer,” Ladybug Tools, 2023, Accessed: Nov. 17, 2023. [Online]. Available: https://docs.ladybug.tools/ladybug-primer/components/3_analyzegeometry/incident_radiation ⌃
- K. Ahmed Ali, M. I. Ahmad, and Y. Yusup, “Issues, Impacts, and Mitigations of Carbon Dioxide Emissions in the Building Sector,” Sustainability, vol. 12, no. 18, p. 7427, Sep. 2020, doi: 10.3390/su12187427. ⌃
- “Zero Carbon Building Design Standard Version 3,” Canada Green Building Council. [Online]. Available: https://www.cagbc.org/ ⌃ ⌃2
- B. Baharuddin, “Analisis Potensi Tegakan Bambu Parring (Gigantochloa Atter) sebagai Penyerap dan Penyimpan Karbon (Studi Kasus Pengelolaan Hutan Bambu Rakyat di Tanralili Kabupaten Maros).,” 2013. ⌃
- R. J. N. Jakica and J. E. Yang, “BIPV Design and Performance Modelling: Tools and Methods,” 2019. ⌃
- Robert McNeel & Associates, “Rhinoceros 3D,” Robert McNeel Assoc., 2022, Accessed: Nov. 22, 2024. [Online]. Available: https://www.rhino3d.com/ ⌃
- Robert McNeel & Associates, “Grasshopper,” Robert McNeel Assoc., 2022, Accessed: Nov. 22, 2024. [Online]. Available: https://www.grasshopper3d.com/ ⌃
- J. de S. Freitas, J. Cronemberger, R. M. Soares, and C. N. D. Amorim, “Modeling and assessing BIPV envelopes using parametric Rhinoceros plugins Grasshopper and Ladybug,” Renew. Energy, vol. 160, pp. 1468–1479, Nov. 2020, doi: 10.1016/j.renene.2020.05.137. ⌃
- J. Hofer, A. Groenewolt, P. Jayathissa, Z. Nagy, and A. Schlueter, “Parametric analysis and systems design of dynamic photovoltaic shading modules,” Energy Sci. Eng., vol. 4, no. 2, pp. 134–152, Mar. 2016, doi: 10.1002/ese3.115. ⌃
- C.-M. Kuan, S.-C., Chan, C.-C., and Shu, “A Study of BIPV Net-Zero Energy Building,” Int. J. Smart Grid Clean Energy, vol. 3, no. 1, pp. 64–69, 2013. ⌃
- E. Saretta, P. Bonomo, and F. Frontini, “A calculation method for the BIPV potential of Swiss façades at LOD2.5 in urban areas: A case from Ticino region,” Sol. Energy, vol. 195, pp. 150–165, Jan. 2020, doi: 10.1016/j.solener.2019.11.062. ⌃
- Climate.OneBuilding, “climate.onebuilding.org.,” climate.onebuilding.org, 2024, Accessed: Oct. 07, 2023. [Online]. Available: https://climate.onebuilding.org/ ⌃
- Climate.OneBuilding, “EnergyPlus Weather File (EPW) Data Dictionary: Auxiliary Programs — EnergyPlus 8.3.,” 2015, Accessed: Nov. 17, 2023. [Online]. Available: https://bigladdersoftware.com/epx/docs/8-3/auxiliary-programs/energyplus-weather-file-epw-data-dictionary.html ⌃
- Climate.OneBuilding, “\climatewebsite\WMO_Region_5_Southwest_Pacific\IDN_Indonesia,” 2023, Accessed: Dec. 10, 2023. [Online]. Available: https://climate.onebuilding.org/WMO_Region_5_Southwest_Pacific/IDN_Indonesia/index.html ⌃ ⌃2
- Ladybug Tools, “Photovoltaics Surface - Ladybug - Component for Grasshopper.,” Grasshopp. Docs, 2023, [Online]. Available: https://grasshopperdocs.com/components/ladybug/photovoltaicsSurface.html ⌃
- Ladybug Tools, “Simplified Photovoltaics Module - Ladybug - Component for Grasshopper,” Grasshopp. Docs, 2023, Accessed: Oct. 07, 2023. [Online]. Available: https://grasshopperdocs.com/components/ladybug/simplifiedPhotovoltaicsModule.html ⌃
- Google Maps, “Kualanamu International Airport, North Sumatera Utara, Indonesia,” Google Maps, 2023, Accessed: Nov. 17, 2023. [Online]. Available: https://maps.app.goo.gl/xbhrbLC7W1y8qr1R9 ⌃
- V. Khare, P. Chaturvedi, and M. Mishra, “Solar energy system concept change from trending technology: A comprehensive review,” e-Prime - Adv. Electr. Eng. Electron. Energy, vol. 4, p. 100183, Jun. 2023, doi: 10.1016/j.prime.2023.100183. ⌃
- M. E. Matius et al., “On the Optimal Tilt Angle and Orientation of an On-Site Solar Photovoltaic Energy Generation System for Sabah’s Rural Electrification,” Sustainability, vol. 13, no. 10, p. 5730, May 2021, doi: 10.3390/su13105730. ⌃
Recent Posts #
WorksBeyond Static
ConceptsNiwakaform
ConceptsWeightless