X Transit Hub
Walkability Model Using Dynamic multi-layer Method in Transit Hub Design
Details
Location
West Jakarta, Indonesia
Details
Master’s Thesis: Individual work
Course
Thesis
Contributor
Abstract
This thesis delves into the challenges, methodologies, and solutions associated with the design of a transit hub (TH) in Jakarta that integrates both public transportation and public spaces (PS). A Dynamic Multi-Layer (DML) method addresses these intricate challenges by examining traffic density, simulating pedestrian movements, and optimizing for multiple objectives, such as minimizing distance to PS and reducing the total number of PS. The ultimate solution serves as a blueprint for the TH design, emphasizing human mobility, connectivity, and greenery.
Advisor
Aswin Indraprastha
Jury
M. Donny Koerniawan; Heru W. Poerbo
Cite
Design#
Methodology#
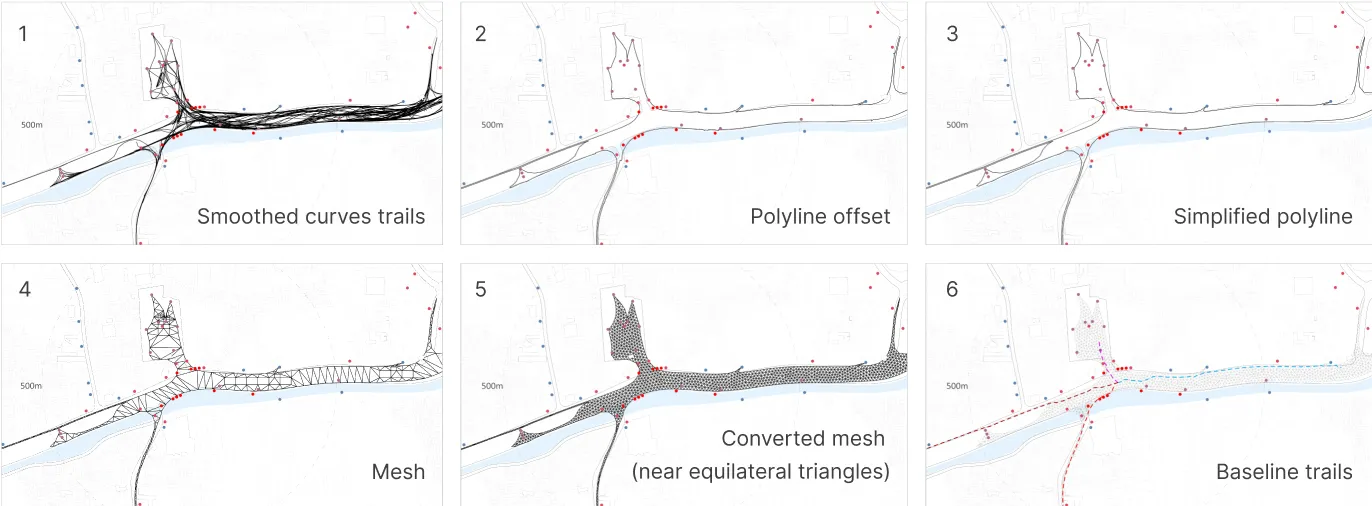
DML method framework. These are: traffic analysis (1), dynamic crowd modeling (2), the smoothing and simplification of multiple paths (3), multi-objective optimization (4 and 5), and solution clustering and selection (6).
Data Gathering & Modeling Preparation (Traffic Analysis)#
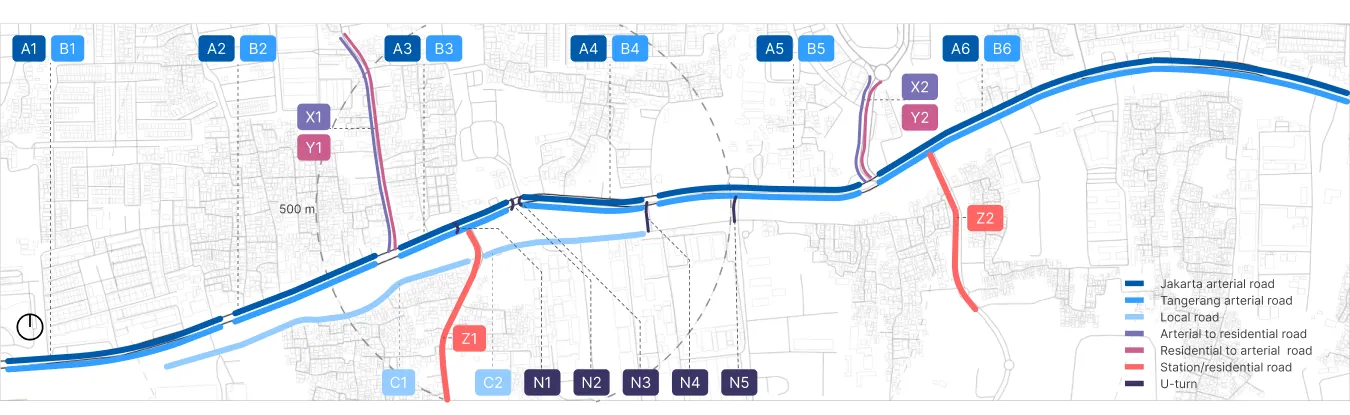
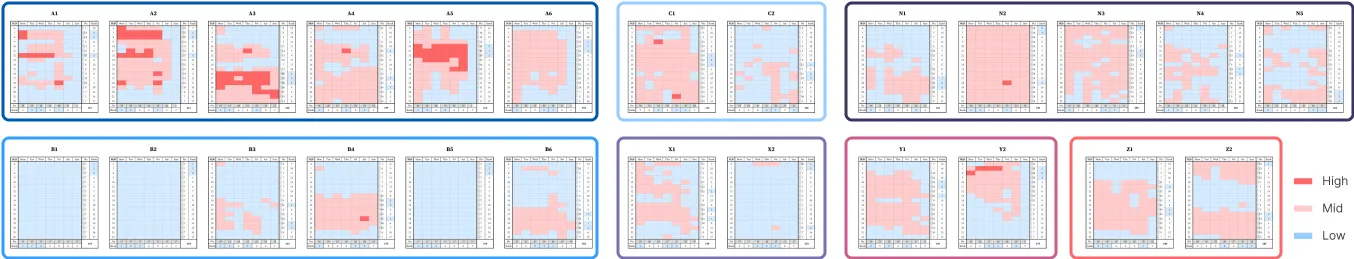
In Layer 1, Google Maps Typical Traffic (GMTT) data (6 AM — 10 PM) analyzed congested routes and pedestrian movements. On-ground mapping and digital tools like Rhino, Grasshopper, and Caribou played crucial roles. GMTT data, ranked 1 to 3 for traffic densities, guides Layer 2 in identifying attraction points and key agents.
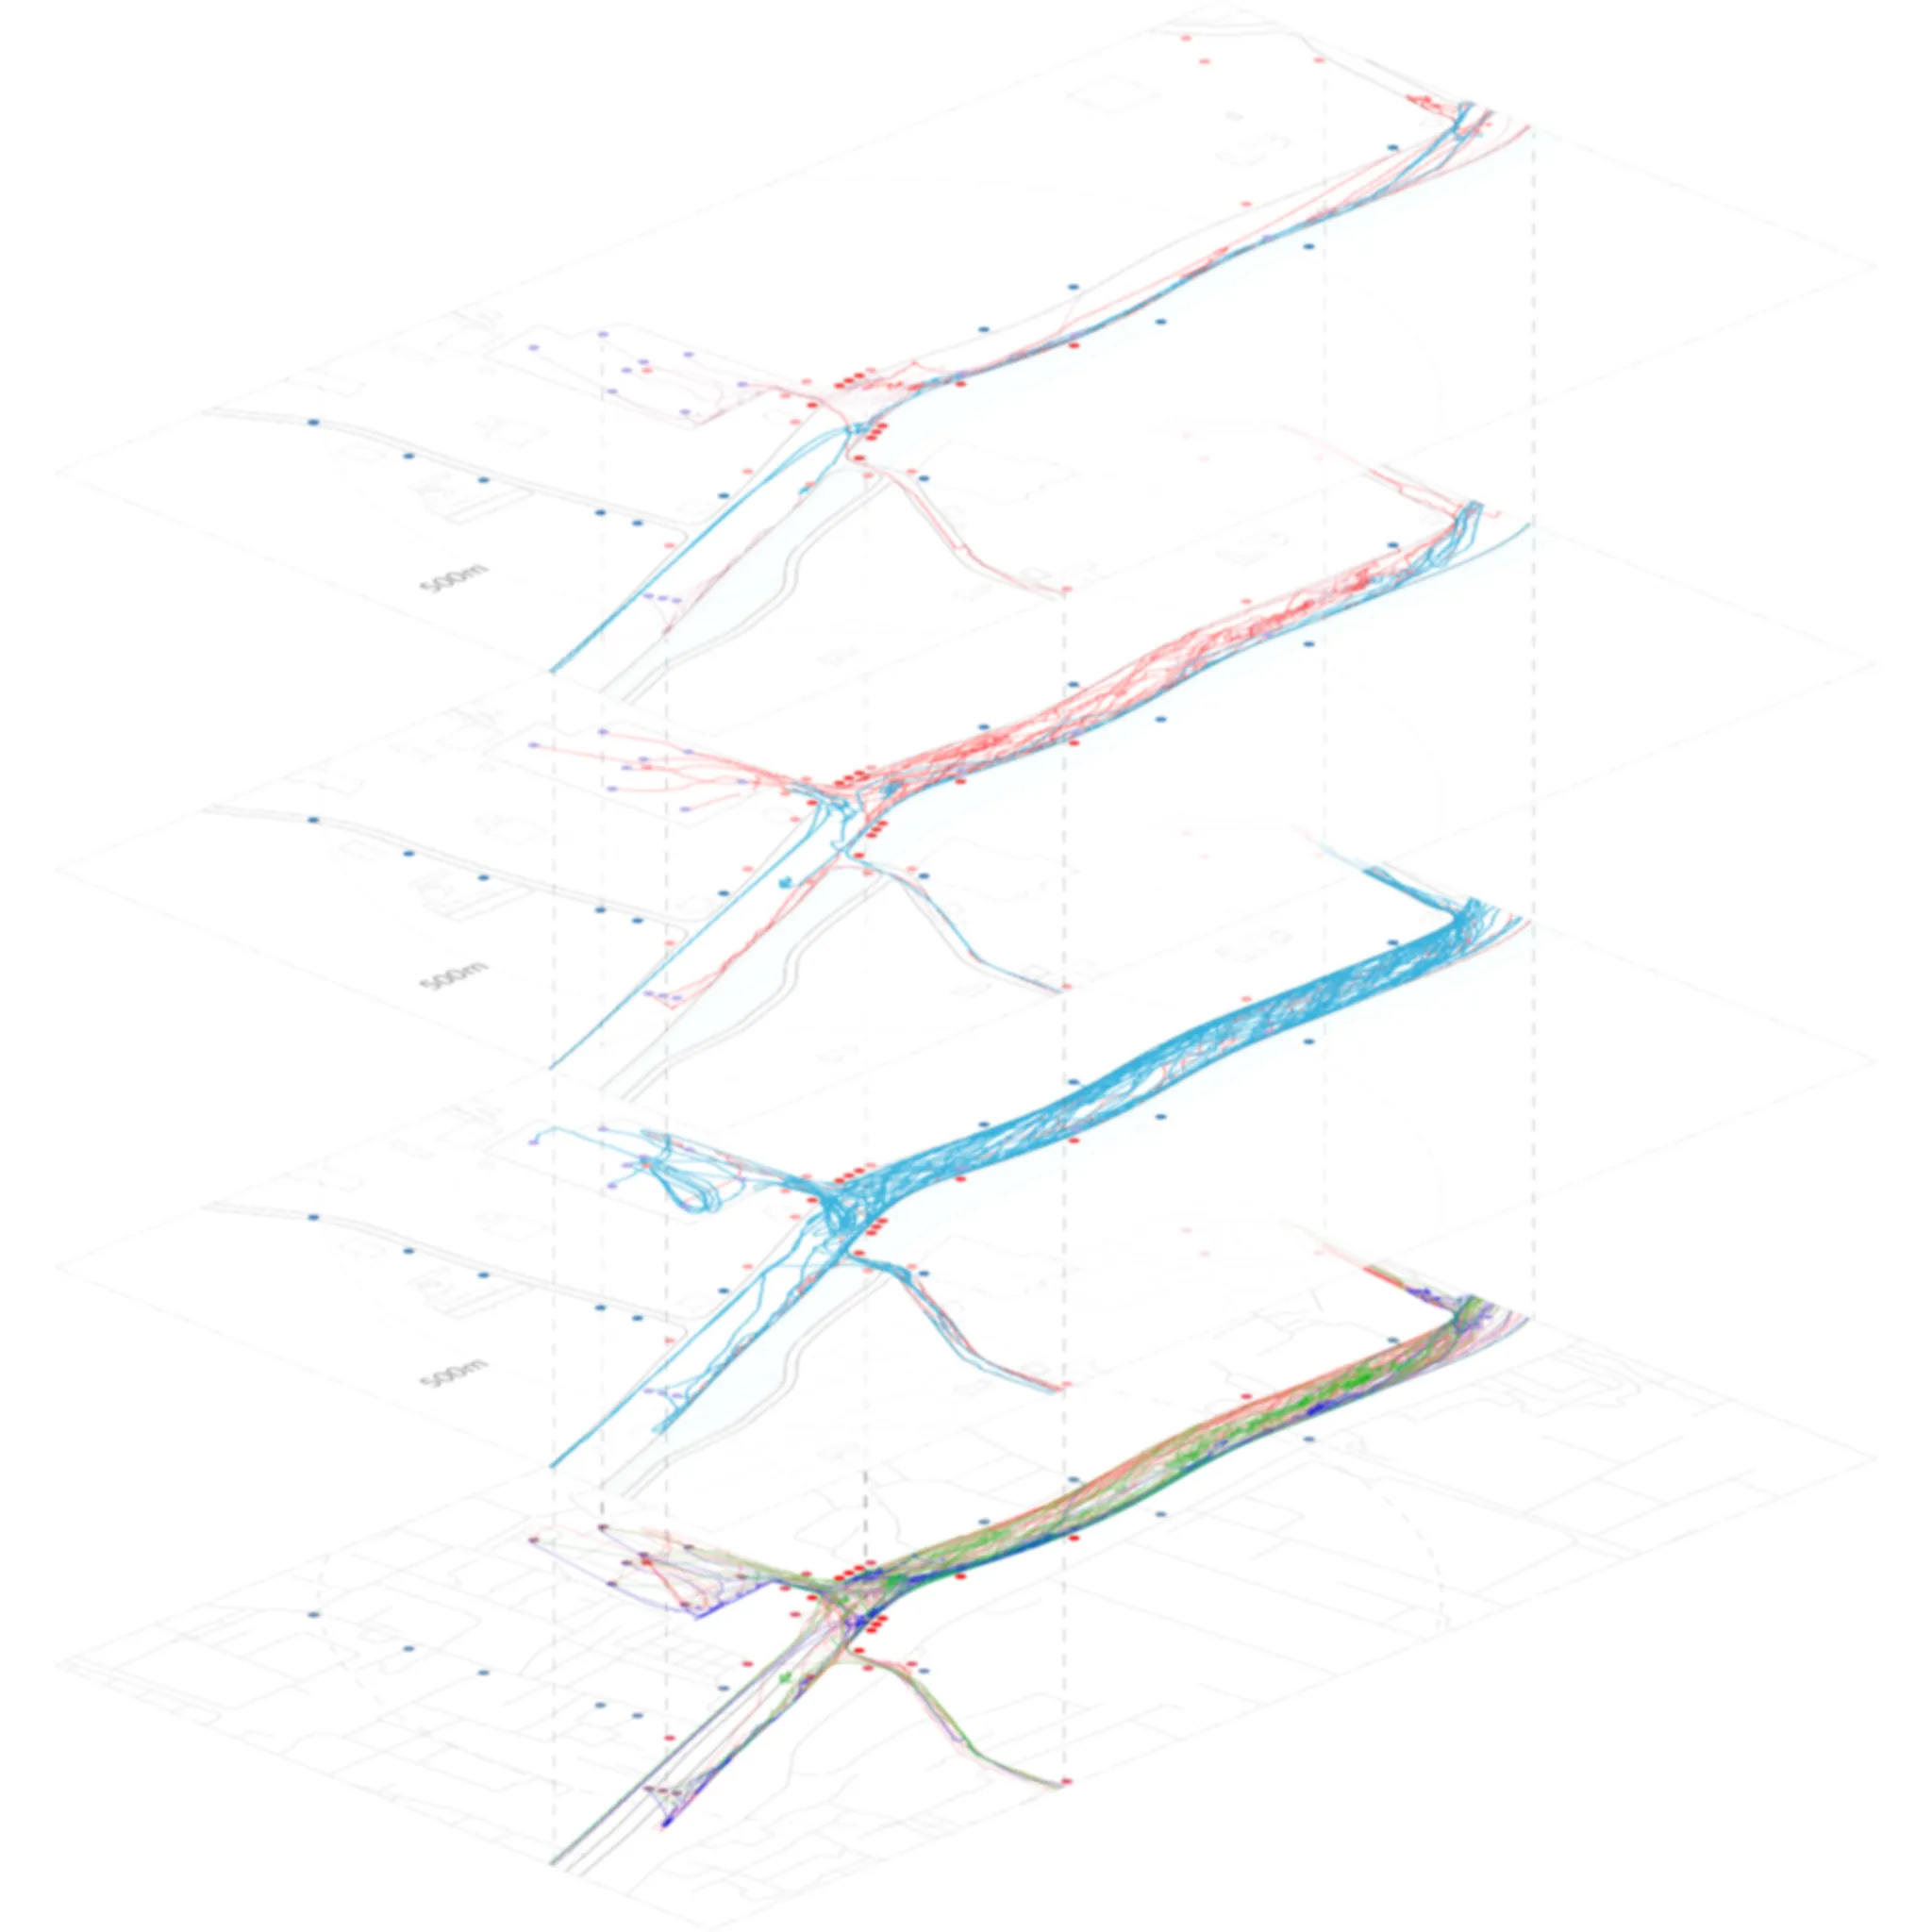
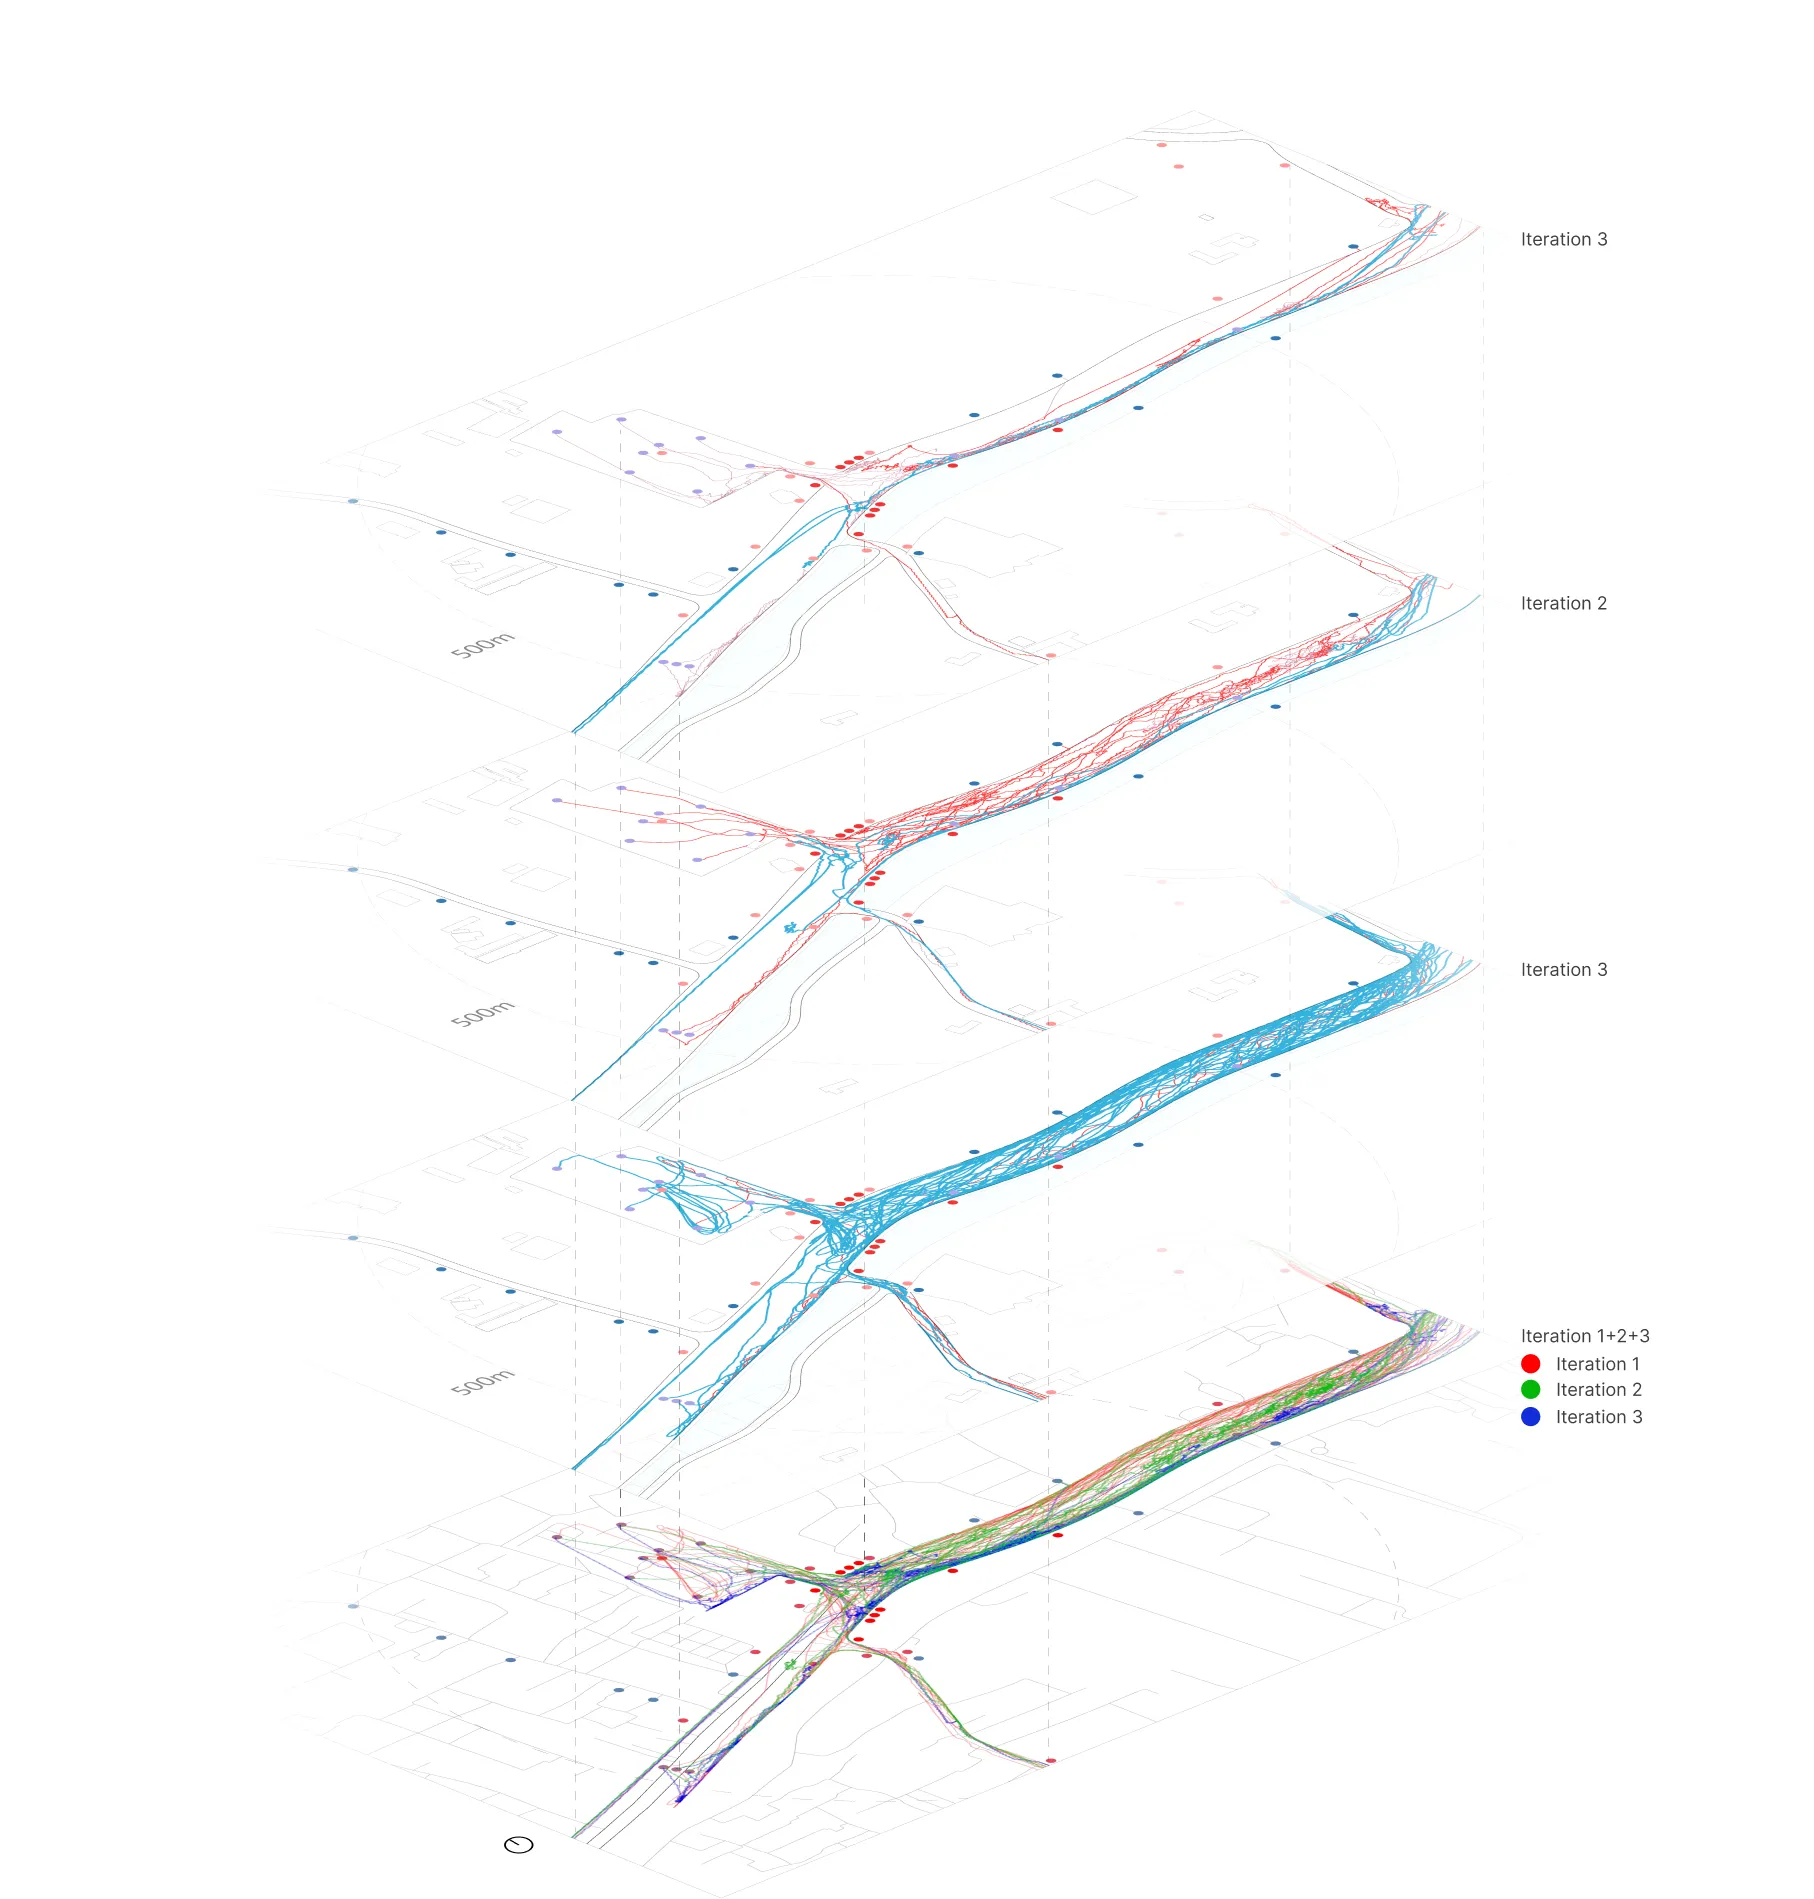
Predicting Dynamic Model of Complex System#
| Configuration | Description |
|---|---|
| Solo Commuting (Iteration 1) | Designed for students and working professionals, this configuration activates Wandering while deactivating Align Force. |
| Solo Walking (Iteration 2) | Tailored for leisure walkers, this configuration deactivates both Wandering and Align Force. |
| Group Touring (Iteration 3) | Configured for group tours, this setup deactivates Wandering and activates Align Force. |
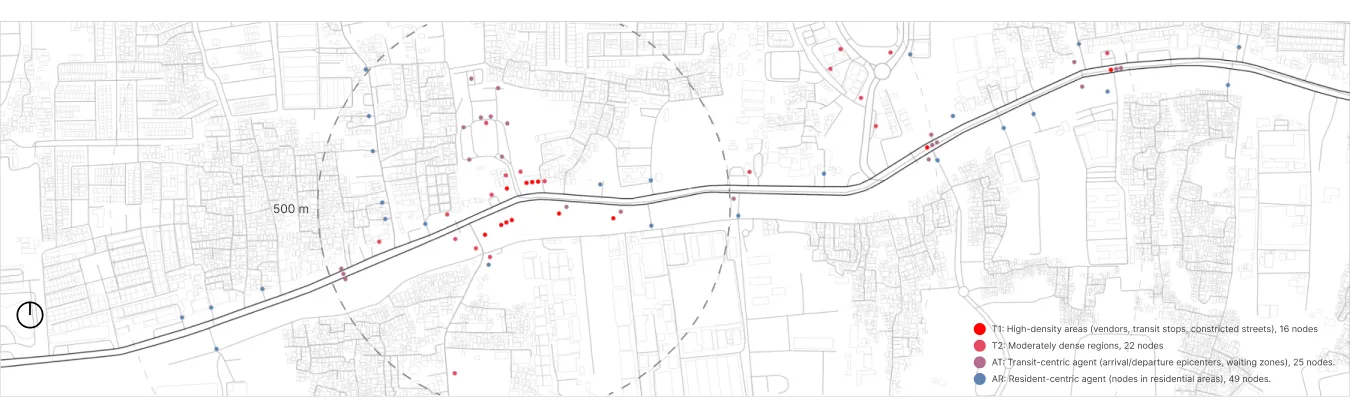
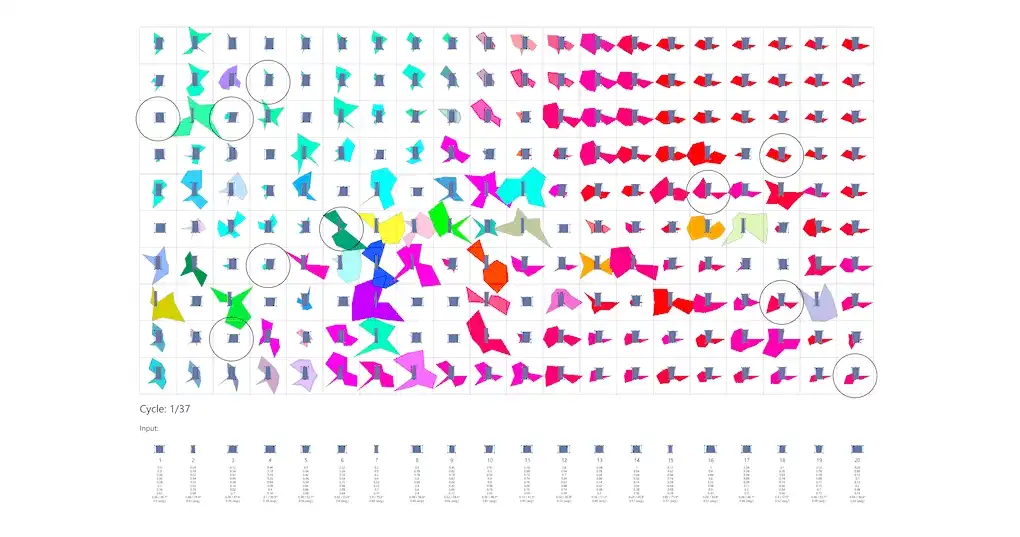
In Layer 2, utilizing agent-based simulation, agent configurations for AR, AT, T1, and T2 were derived from insights in Layer 1 through three iterative refinements. Configurations include Solo Commuting (students, professionals), Solo Walking (leisure walkers), and Group Touring (group tours). After 300 steps using tools like Grasshopper and Quelea, agent trajectories were evaluated, revealing patterns. Iteration 1 facilitates smooth navigation, Iteration 2 shows agent clustering in bustling zones, and Iteration 3 sees dense congregation around T1 and T2, indicating congestion hotspots. The simulations provide insights for urban renewal projects and infrastructure enhancements.
Simplifying the Trails#
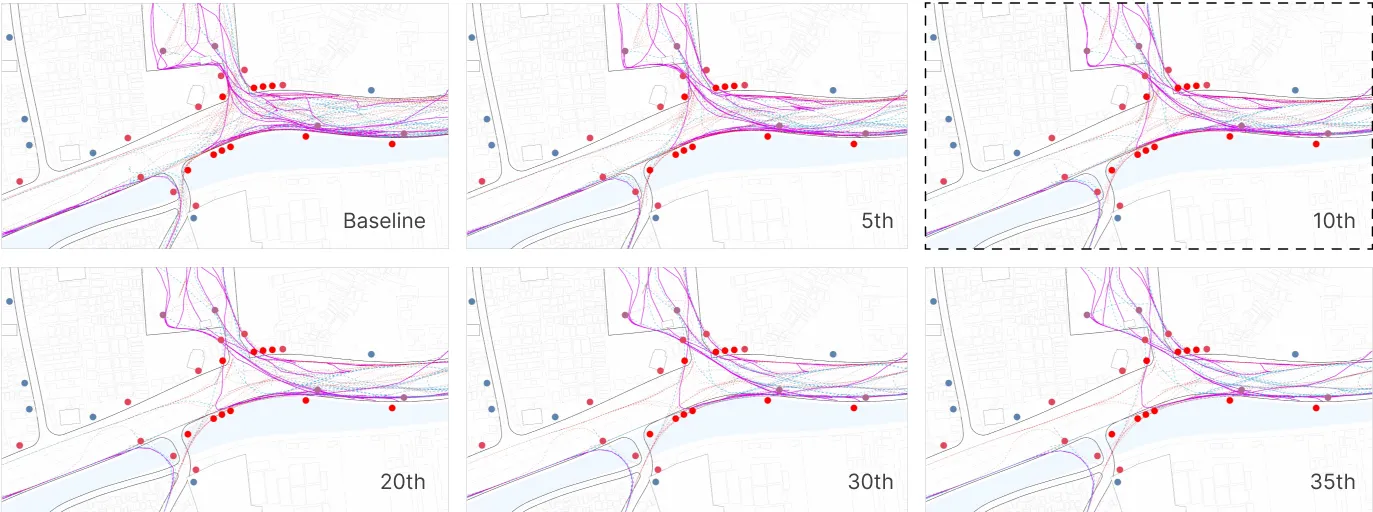
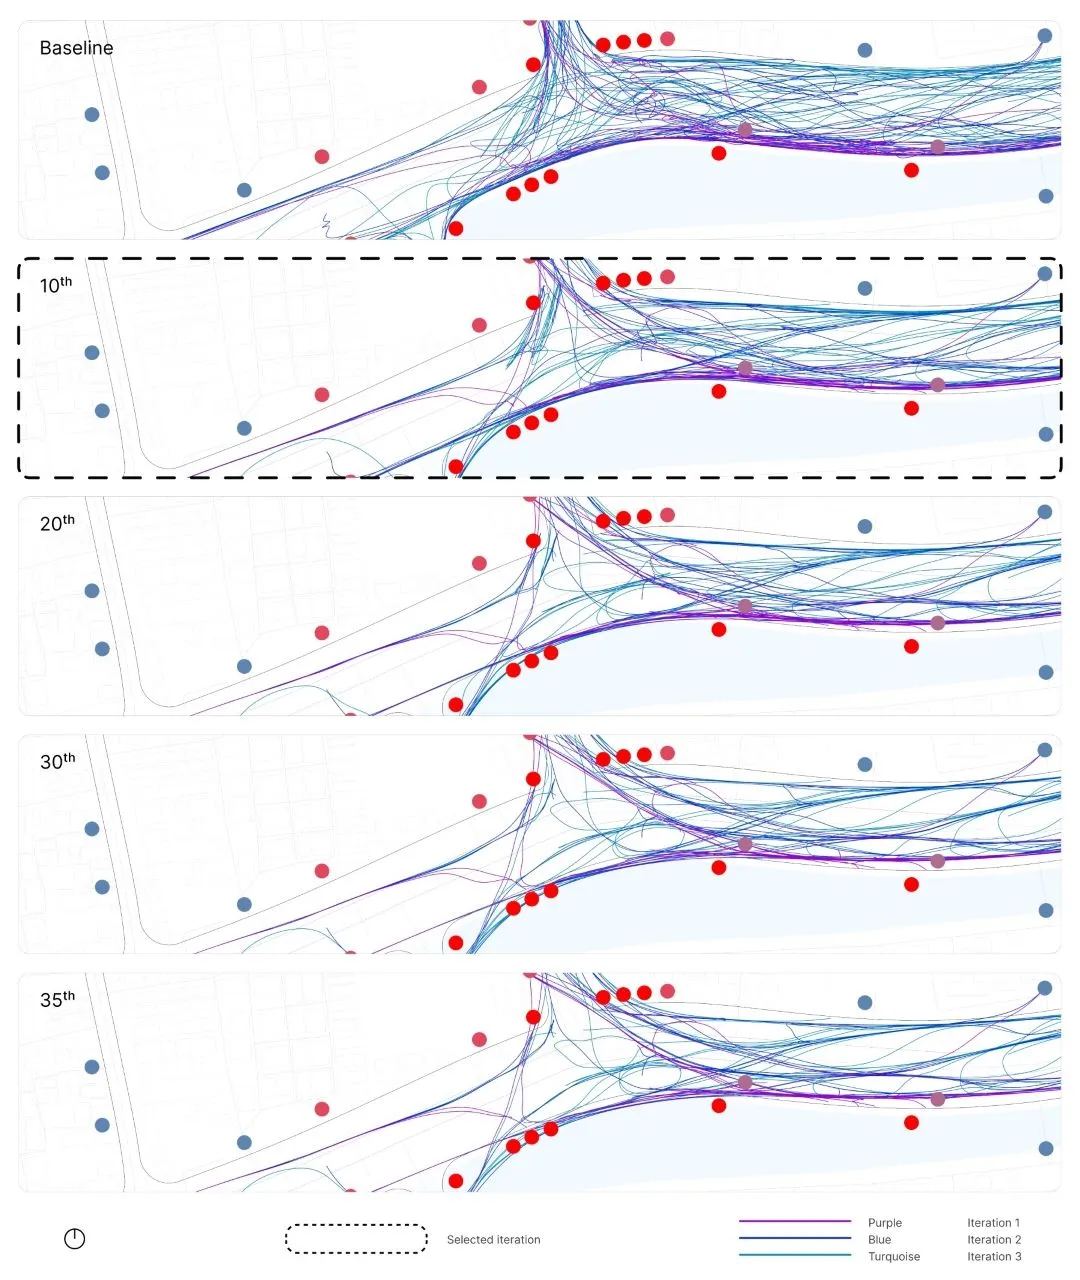
In Layer 3, data from three Layer 2 iterations is smoothed using Laplacian technique, maintaining even spacing. Modal points undergo iterative modifications, aligning with the 10th iteration and defining mesh space with shortest path algorithm (SPA). Aligned with TOD Standard 3.0 and SDGs 11 for robust transportation infrastructure and urban design.
Defining the Objectives#
In Layer 4, SPA and A-star algorithms converge, paving the way for optimization in Layer 5. The computational agility of A-star transforms input lines into a refined foundational mesh using TriRemesh in Kangaroo2. This mesh serves as trails for SPA, with T1 and T2 as terminal markers (nodes).
Optimizing the Objectives#
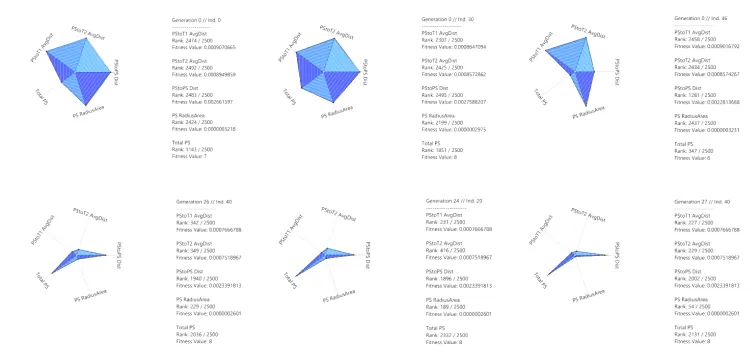

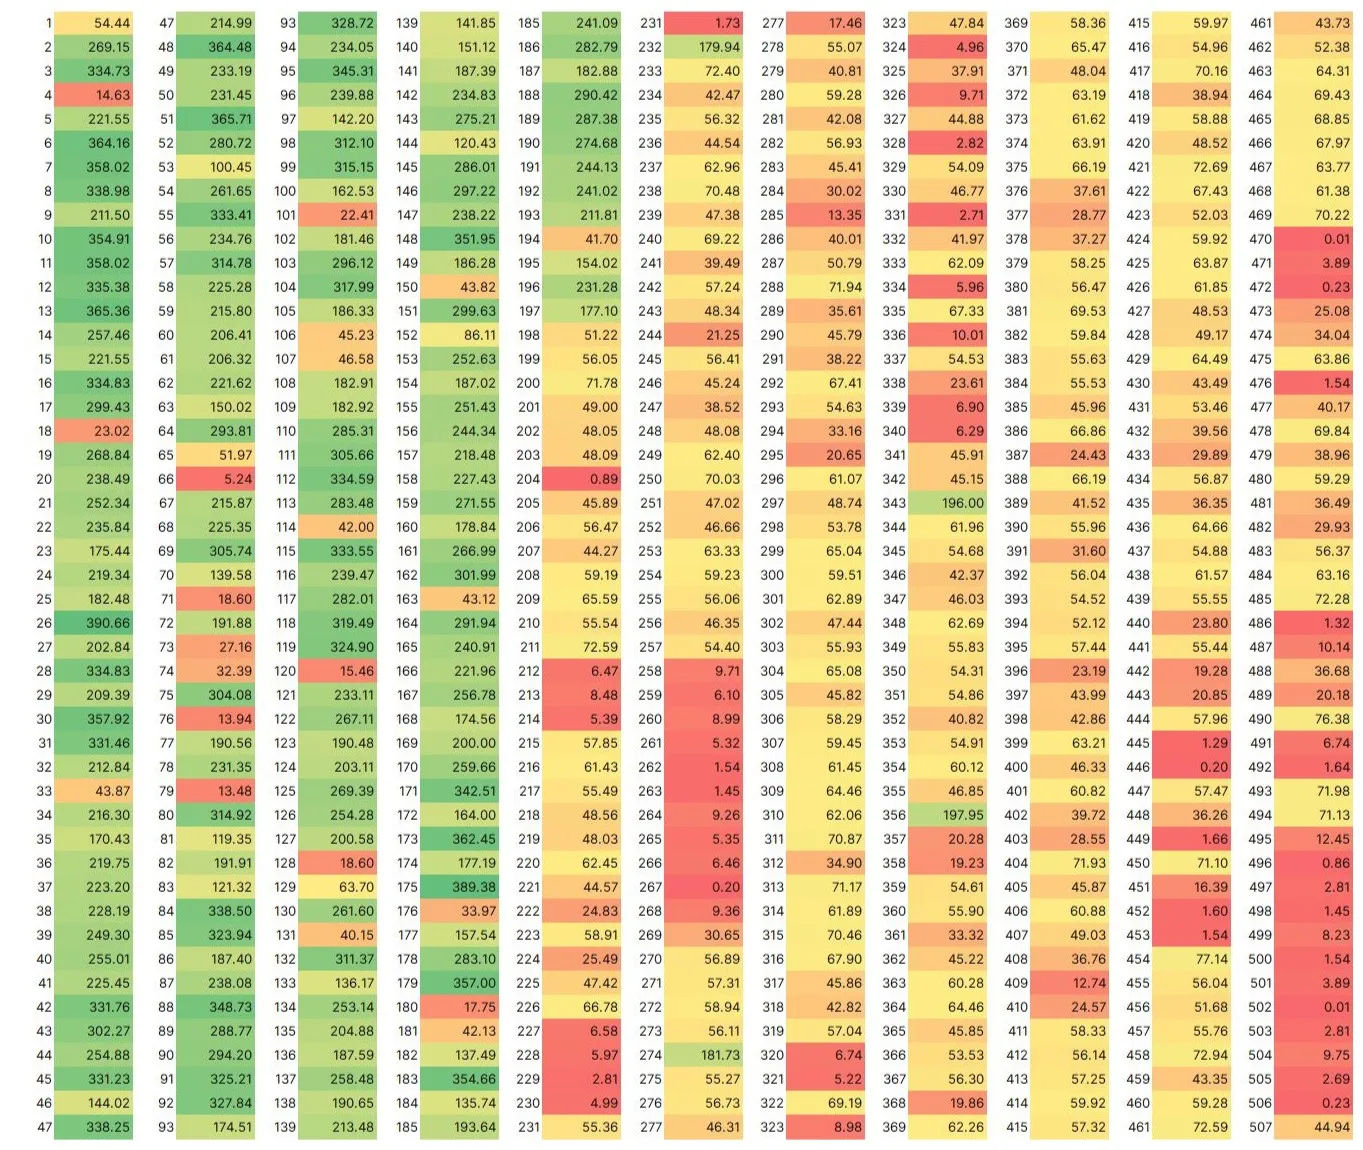
In Layer 5, EMOO simulation, driven by NSGA-2, aims for advanced outcomes. Fitness Objectives (FO) prioritize average route distances, Voronoi radii area, and total potential Public Space (PS) count, emphasizing uninterrupted mobility, placemaking, and urgency. The study, evaluating 2,500 potential solutions with Wallacei, confirms the method’s effectiveness, setting the stage for the next layer to select the best design guideline through solution clustering techniques.
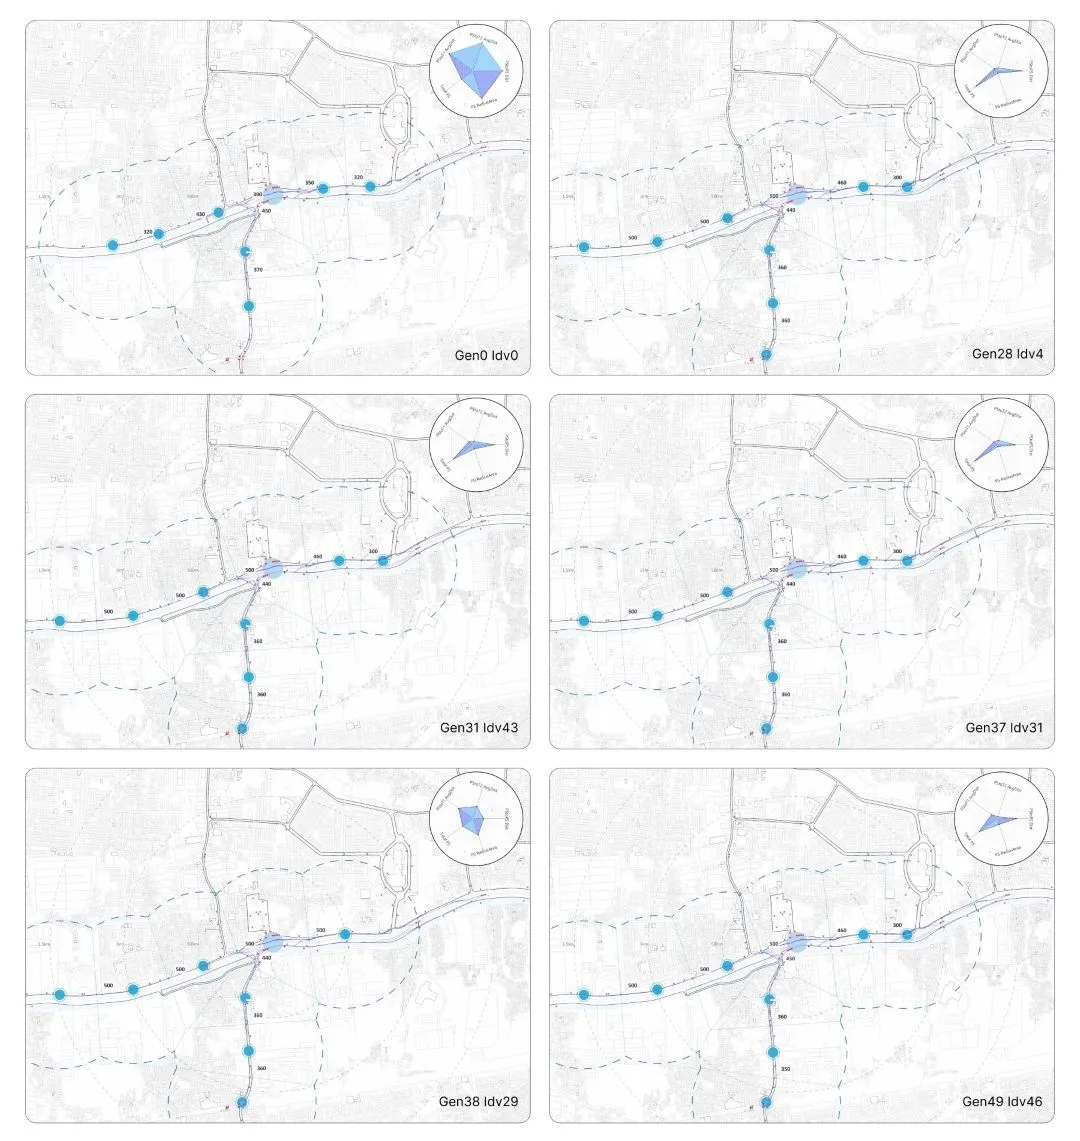
Clustering & Selecting the Best Solution#
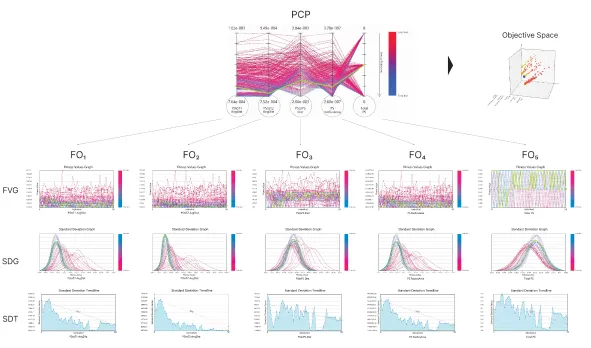
In Layer 6, the focus is on detailed clustering of the extensive set of 2,500 solutions using the SC method. The objective is to determine the most pertinent design guidelines. This method unfolds over five phases, collectively termed “solution clustering,” fine-tuned to choose the most suitable solution for the study.
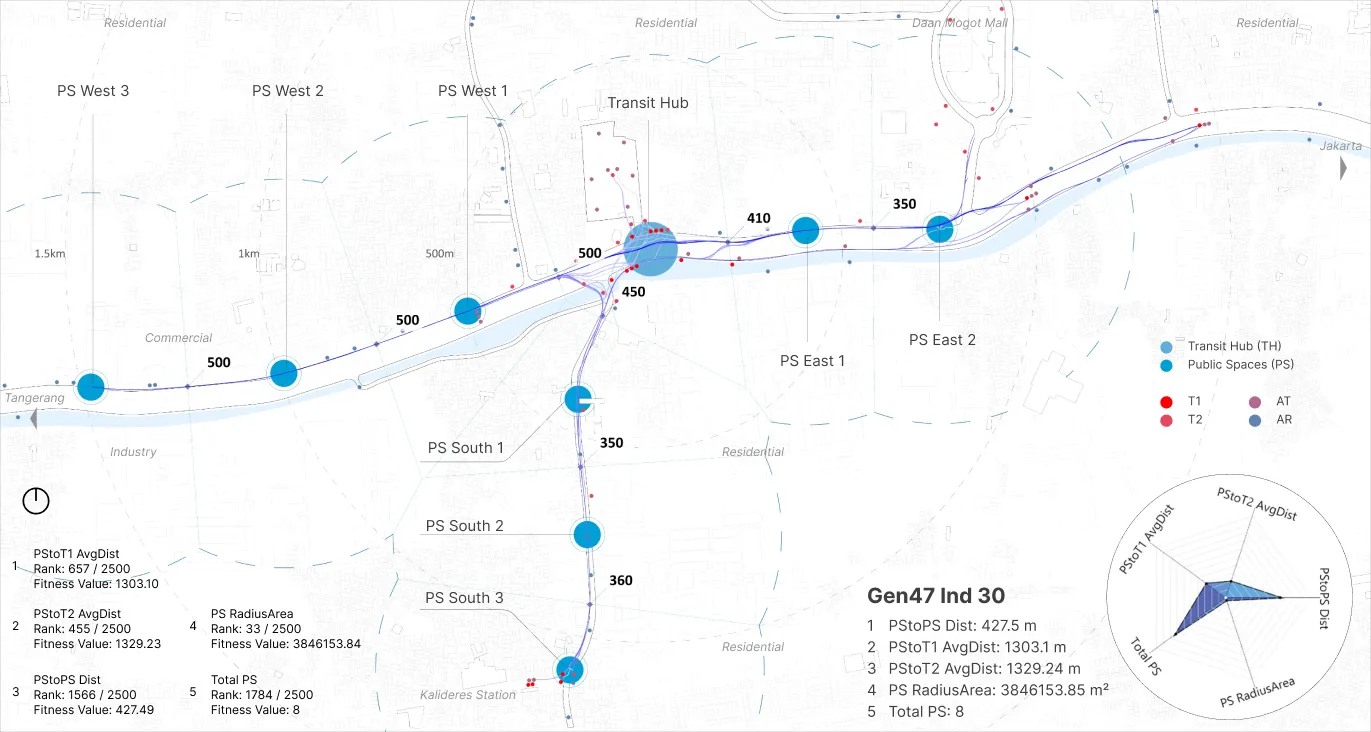
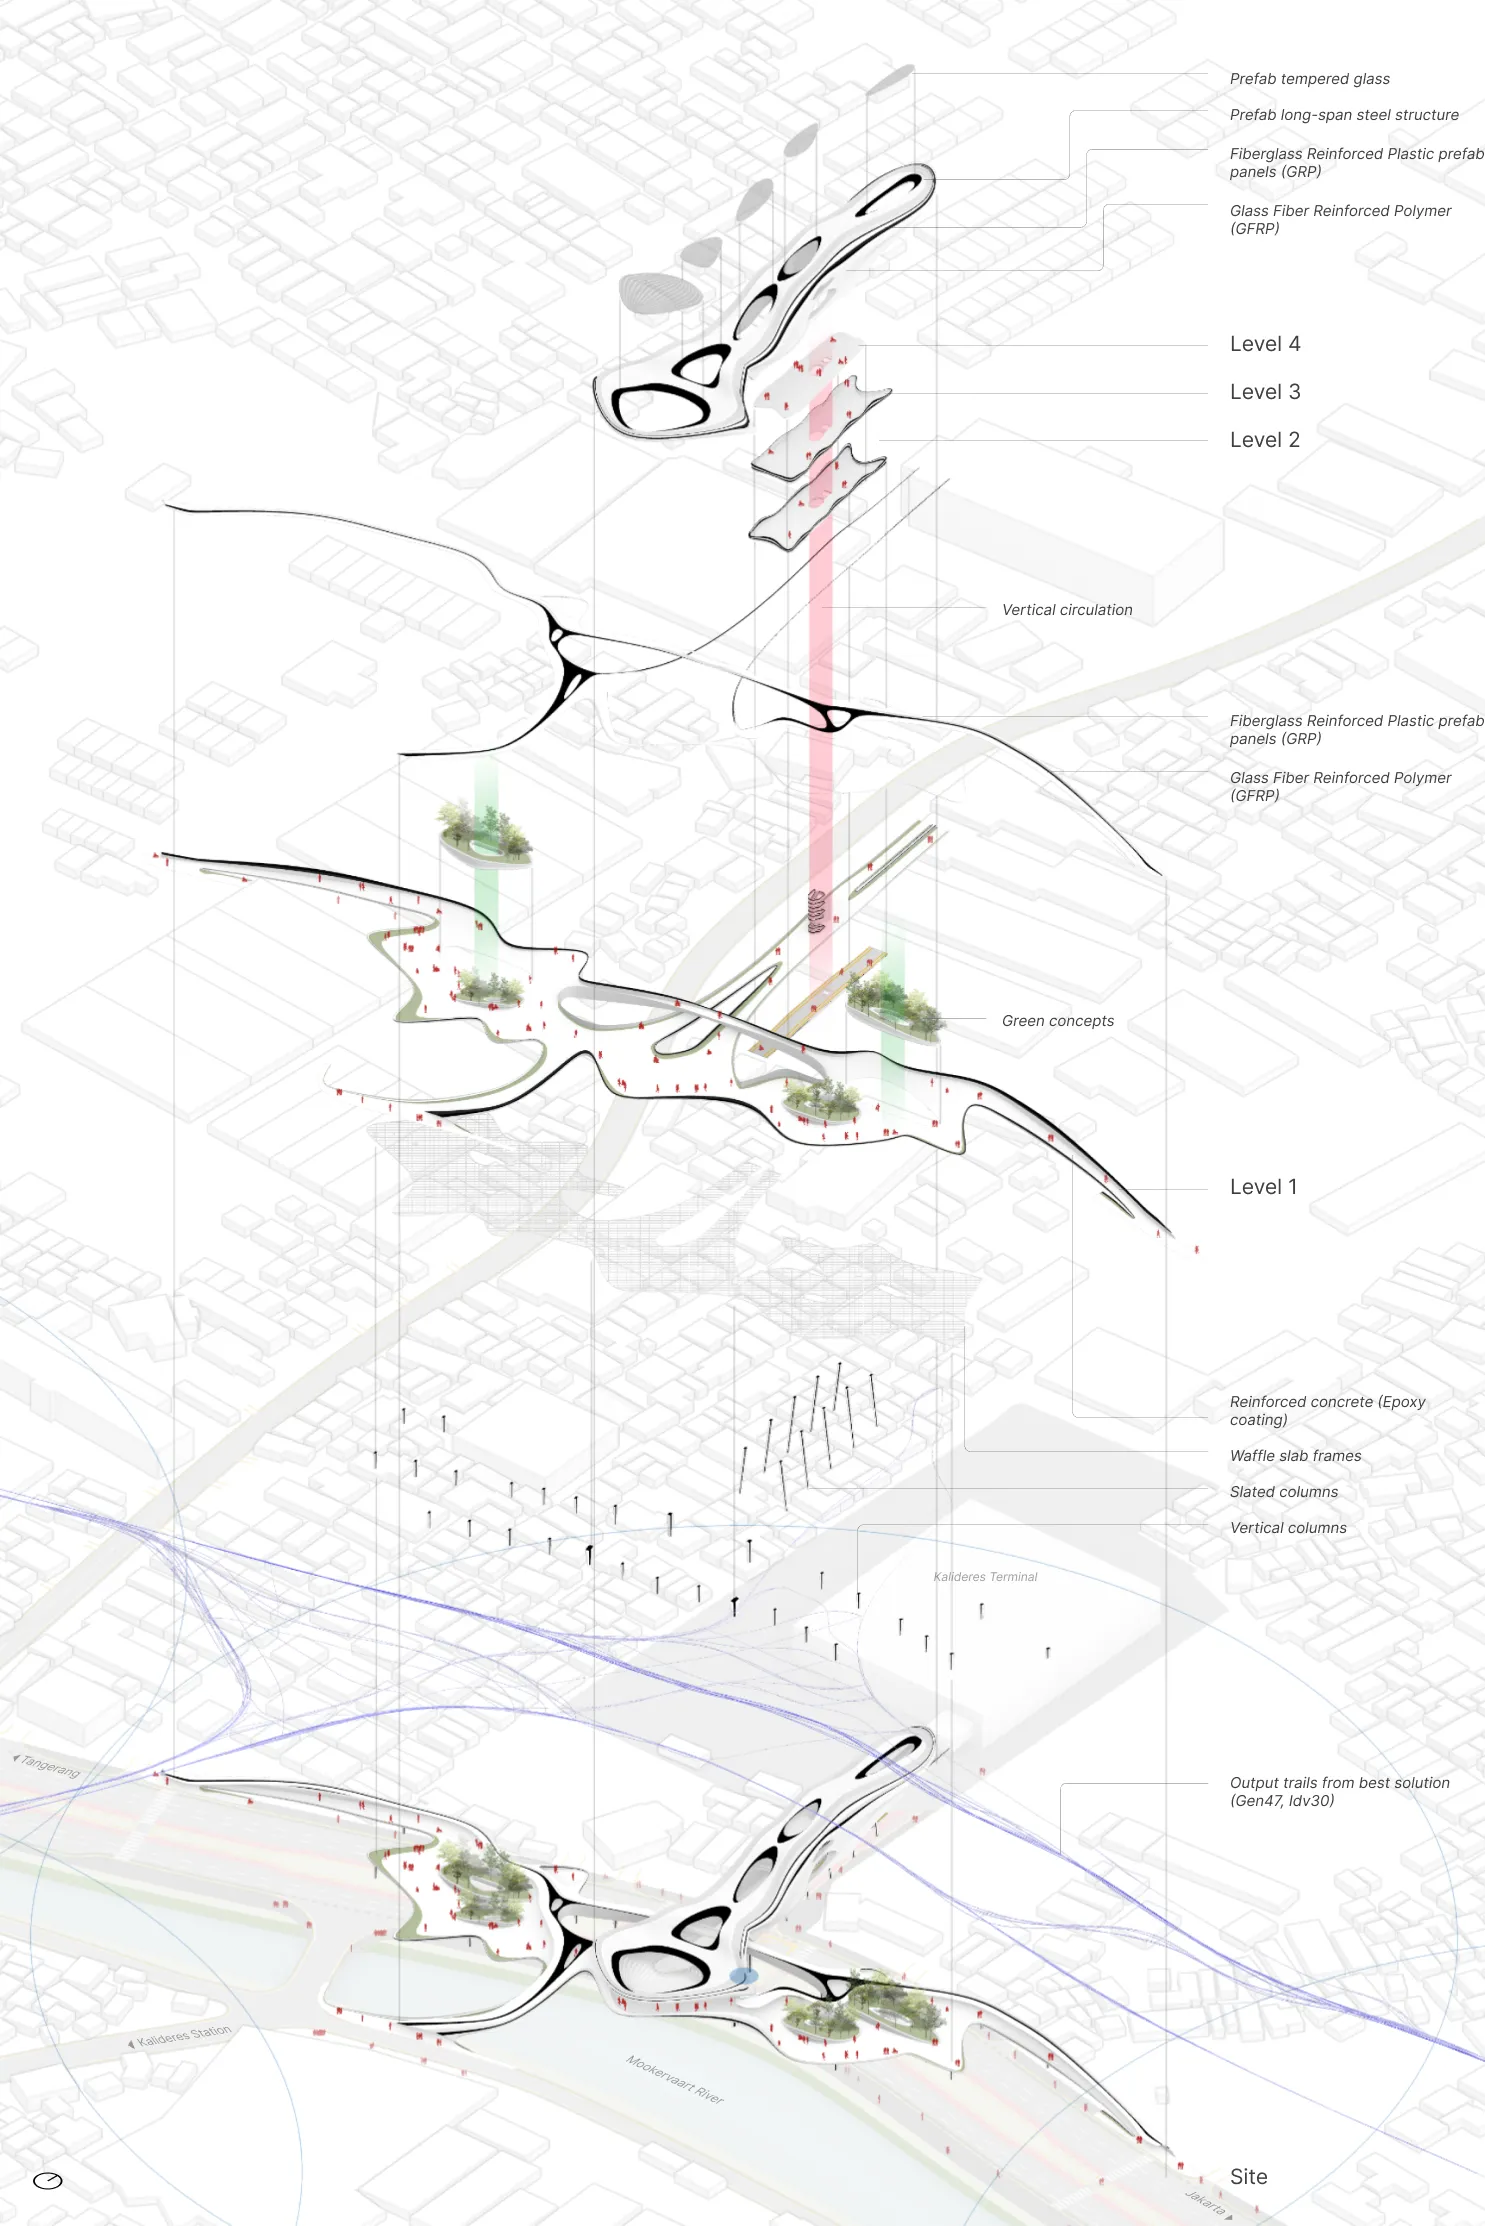
Upon reevaluating the chosen solution (Gen47 Idv30), the initial criteria set for all FOs were revisited. Ideally, these criteria should align with the highest standards, particularly when compared to the clusters identified in Layer 6. Achieving the set goals for each FO is crucial. The assessment reveals that all objectives have been met, positioning the selected solution as a leading design guideline for the TH in the first section of this portfolio. Additionally, this solution serves as a blueprint for future planning of PS in the context.
Finding#
In the Dynamic multi-layer (DML) methodology, Walkability Model (WM) is employed to track agent movement effectively, distinguishing between primary and secondary movement patterns. This approach, combined with Agent-Based Modeling (ABM), provides valuable insights for designing TH and PS. The use of WM plays a crucial role in understanding the walkable aspects of urban spaces, aiding in the formulation of design guidelines.
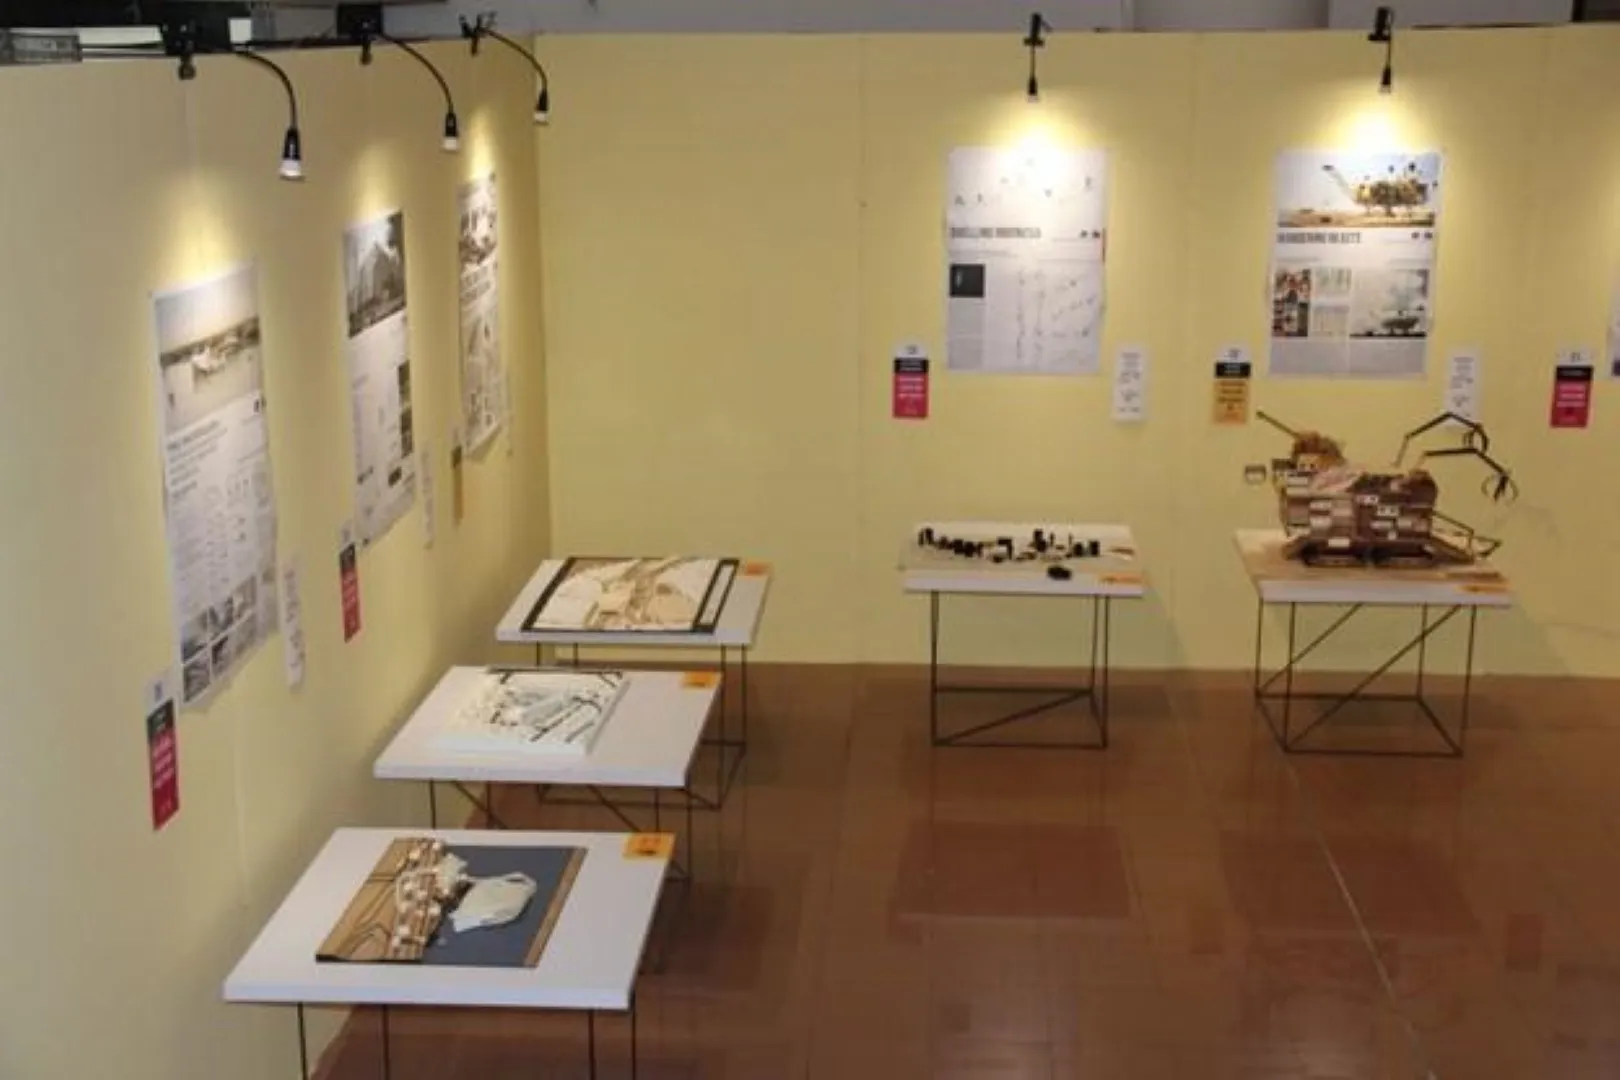
Media#
Recent Posts #
WorksBeyond Static
ConceptsNiwakaform

ConceptsWeightless