SAGE Publications International Journal of Architectural Computing
Research Article, , https://doi.org/10.1177/14780771241254639
Dynamic multi-layer walkability model for transit-oriented movement: Nodes and Routes optimization method
Details
Authors
Arnott Ferels; Aswin Indraprastha
DOI
10.1177/14780771241254639
URL
Publisher
SAGE Publications
Journal
International Journal of Architectural Computing
ISSN
1478-0771
Cite
Ferels A, Indraprastha A. Dynamic multi-layer walkability model for transit-oriented movement: Nodes and Routes optimization method. International Journal of Architectural Computing. 2025;23(1):65-95. doi:10.1177/14780771241254639
Contents#
- Abstract
- Keywords
- 1. Introduction
- 2. Case study
- 3. Method
- 4. Discussions
- 5. Limitations
- 6. Conclusion
- 7. Recommendations
- References
Abstract#
This paper presents a novel approach to optimizing movement in urban areas through a dynamic multi-layer walkability model. This research uncovers new facets of walkability modeling within transit-oriented movement, aligning pedestrian pathways (Routes) with urban architecture, public spaces, and green spaces (Nodes). The dynamic multi-layer (DML) approach involves optimizing both the Nodes and Routes of the transit system using a multi-objective optimization method. This method improves accessibility and connectivity by aggregating the results of agent-based modeling for route simulations and considers multiple criteria, including greenness, distance to transit, and destination accessibility. Experimentation with a case study produced several findings that underscore the value of multi-layered models for transit movement and the power of computational methods in optimizing both Nodes and Routes. This discovery offers valuable insights into the DML process and its potential applications in the field of urban design and architecture.
Keywords#
Multi-layer; Walkability model; Transit-oriented movement; Optimization method; Agent-based modeling
1. Introduction#
Urban areas globally are confronted with challenges caused by inadequate infrastructure, resulting in decreased physical activity, mainly walking and cycling, and hindering transit connectivity.1,2,3,4,5 These issues are influenced by many factors, such as high population density and behavioral patterns shaped by urban culture.6 The resultant challenges extend to physical structures and have socio-economic implications for cities.6
In the context of rapid urbanization, there is an urgent need for improved urban and transport planning to address these challenges effectively.7 Policymakers and planners play a significant role in promoting human-oriented mobility and environmental interactions, especially in densely populated cities.8,9 Their interventions are vital in fostering walkability and cycling, directly impacting the sustainability and livability of urban areas.10 Strategies like developing integrated transportation hubs with public amenities like green spaces offer cost-effective solutions to mitigate climate change impacts.7,11
Incorporating walkability principles into urban planning promotes a healthier urban environment by including green spaces and pedestrian-friendly features.4,12,13 Through deep analysis and problem identification using bottom-up modeling approaches,14,15 complex traveler interactions can be simulated to optimize planning and design outcomes. This approach significantly contributes to reducing unnecessary physical activities such as sprawl, congestion, and segregation within cities.16
To improve the quality of life for urban residents, integrating smart urban development strategies and empirical measurements into urban planning is crucial, especially for long-term planning.17 Prioritizing human-centered concepts over vehicle-oriented ones and focusing on environmental sustainability can significantly enhance the city’s effectiveness and livability. This includes prioritizing mass transportation over private vehicles to minimize urban sprawl and congestion, ultimately making cities more compact and livable.18
In conclusion, implementing sustainable and human-centered approaches is essential for enhancing walkability and cycling infrastructure, improving city livability,7 and addressing challenges in underdeveloped urban areas. For instance, shifting from car reliance to mass transport is key to achieving compact cities and reducing uncontrolled urban sprawl.17 Drawing insights from the mentioned studies, this research aims to experiment with a novel approach to address walkability challenges in underdeveloped urban areas.
1.1. Walkability modeling & agent-based modeling and simulation#
Walkability modeling (WM) involves simulating pedestrian movement in constrained environments, which makes it a valuable tool for understanding real-world situations and enhancing our knowledge of pedestrian behavior.15 This method allows for a detailed analysis of programs and patterns, suggesting improvements to existing structures for greater efficiency.19,20 In the context of urban development, WM primarily focuses on assessing how human behavior impacts physical activity, providing insights that are crucial for urban planning and design.21
On the other hand, agent-based modeling is used to simulate the complex nature of walkability and its relationships.22,23,24 Agent-based modeling and simulation (ABMS) provides a deep understanding of existing walking habits that directly affect physical activity in urban contexts.15,25 By examining agent trails generated by ABMS, we can see how pedestrian pathways (Routes) and city features (Nodes) are interconnected, promoting livability and physical activity while also preparing for future mitigation efforts. This modeling method is particularly essential in developing countries, where factors influencing physical activity need to be considered by city stakeholders.26
Integrating ABMS and WM offers significant benefits, including the ability to observe and forecast phenomena.27 Computational methods within ABMS provide advantages such as dynamic feedback mechanisms and realistic behavior modeling.14 However, challenges arise when translating data, including behavior and ethnographic input,28 into the ABMS environment.24,29 Nonetheless, ABMS in WM allows for forecasting in complex scenarios, deepening our understanding of factors influencing human mobility in urban settings.30,31
Recent academic attention has focused on integrating ABMS and WM, particularly in transit-oriented development (TOD), and identifying potential “Nodes” or specific public spaces as key feature.32,33 Notable studies in this area include Badland et al. (2013), who introduced a web-based tool for evaluating and enhancing neighborhood walkability, emphasizing improvements like pedestrian simulations and considering factors such as residential density and traffic flow.34 Herrmann et al. (2017) explored the impact of walkability on walking frequency in neighborhoods, advocating for interventions like reducing parking areas and increasing street-level tree coverage.35 Lu (2017) conducted a comprehensive study on walkability modeling, using GIS methods like Map Overlay and Cost Distance Analysis to identify strategies for promoting walking across various dimensions.36 Kanchik (2017) examined the health impacts of enhanced walkability modeling, revealing connections between architectural elements, perceived safety, physical activity, and overall well-being.37 Additionally, Deng and Zhang (2018) emphasized their research on neighborhood walkability models, providing urban planners with standardized benchmarks derived from a walking speed index and walkability maps,38 thus facilitating urban improvement strategies.39
The studies mentioned above aim to improve neighborhood walkability through pedestrian simulations, benchmarking, and promoting walking to understand its impact on factors like walking frequency, physical activity, safety, and well-being, ultimately enhancing residents’ quality of life in cities. Although these studies do not specifically simulate individual or group movements iteratively in ABMS, they lay the groundwork for future research, including our ongoing research, which aims to enhance accessibility and connectivity. Additionally, they provide a theoretical foundation for understanding how ABMS can be used to parameterize route simulations considering multiple criteria such as greenness, distance to transit, safety perceptions, physical activities, health, and destination accessibility. These studies uncover the complex factors that impact walking behaviors, neighborhood walkability, and the interconnectedness of elements like buildings, safety perceptions, physical activities, and health.
Furthermore, prior research has highlighted the potential of integrating ABMS into upcoming studies to explore a shared vision.40,41,42 This approach leads to a deeper understanding and supports data-driven decisions as reliable problem-solving methods,42 which can ultimately enhance walkability and promote healthier living environments.34 There is also a growing interest in ABMS within architectural research due to its ability to replicate complex structures and behavioral dynamics.41,43 However, current ABMS applications mainly focus on understanding agent capabilities and behaviors, analyzing interaction patterns, and simplifying model representations.44 As a result, in our study, we will further enhance the ABMS method, especially by using ABM to model walkability and optimize movement in urban areas through a novel method that extensively utilizes pedestrian pathways (Routes) along with urban architecture, public spaces, and green spaces (Nodes). This will uncover new facets of walkability modeling within transit-oriented movement.
1.2. Research gap#
To fill the existing research gap in WM, a new approach is essential. This approach involves analyzing the behavioral patterns of individuals and relevant urban features, translating them into computational data, and establishing customized parameters that align with walkability principles, creating livable cities, promoting health, and integrating transportation systems like TOD.15,19,20,21,32
Utilizing crowdsourcing platforms such as OpenStreetMap (OSM) and Google Maps Typical Traffic.45,46,47,48 in conjunction with field walkability observations for ABMS, is crucial for understanding the unique characteristics of each city.12,49,50,51,52,53 By incorporating quantitative data and algorithms, we can enhance the simplified route trails generated by ABMS15,54,55 preparing them for optimization using a multi-objective approach to effectively tackle urban walkability challenges.56 To ensure practical applicability, clustering methods are then applied to organize various approaches, algorithms, methods, and related elements iteratively, based on theoretical frameworks and practical contexts within WM. This clustering process aims to define Nodes and Routes effectively when implemented contextually.
The approach mentioned above is termed the dynamic multi-layer (DML) method, which integrates algorithms such as Laplacian smoothing for trail refinement,57,58 A-star for finding the shortest path,59,60,61 NSGA-2 for evolutionary multi-objective optimization (EMOO)62,63 and iterative clustering to refine trails and determine optimal solutions into a single, optimal solution. The Method section will provide detailed explanations of this DML approach.
In summary, implementing this layered strategy in DML within WM can address current limitations, optimize Nodes and Routes for pedestrian-centric urban design, and enhance connectivity in urban communities.
The paper is structured as follows: The Case study section introduces the context in which the DML method is applied to address urban walkability challenges. The Method section outlines the formulation and explanation of the DML method, including dependencies between each layer parameter. The Discussions section examines the key findings of the DML method and its practical implications. The Limitations section identifies potential constraints and opportunities within the study. Finally, the Conclusion section concludes and emphasizes the significance of the research, highlighting the importance of the DML method and providing implementation recommendations to relevant stakeholders.
2. Case study#
In this section, we will elaborate on the rationale for selecting the Kalideres region in Jakarta as the representative application of the DML method, taking into account its unique contextual characteristics.53
2.1. Urban mobility challenges in Kalideres, Jakarta#
Jakarta, Indonesia’s capital, grapples with significant urban walkability challenges. Specifically, the city suffers from a lack of pedestrian-friendly infrastructure, exemplified by poorly maintained footbridges that force pedestrians into risky behaviors like jaywalking.64 A study conducted by Leather et al. at the Asian Development Bank (ADB) using the Global Walkability Index (GWI) revealed low ratings across residential, educational, commercial, and public transport zones, underscoring Jakarta’s substantial deficiencies compared to other Asian cities.65,66
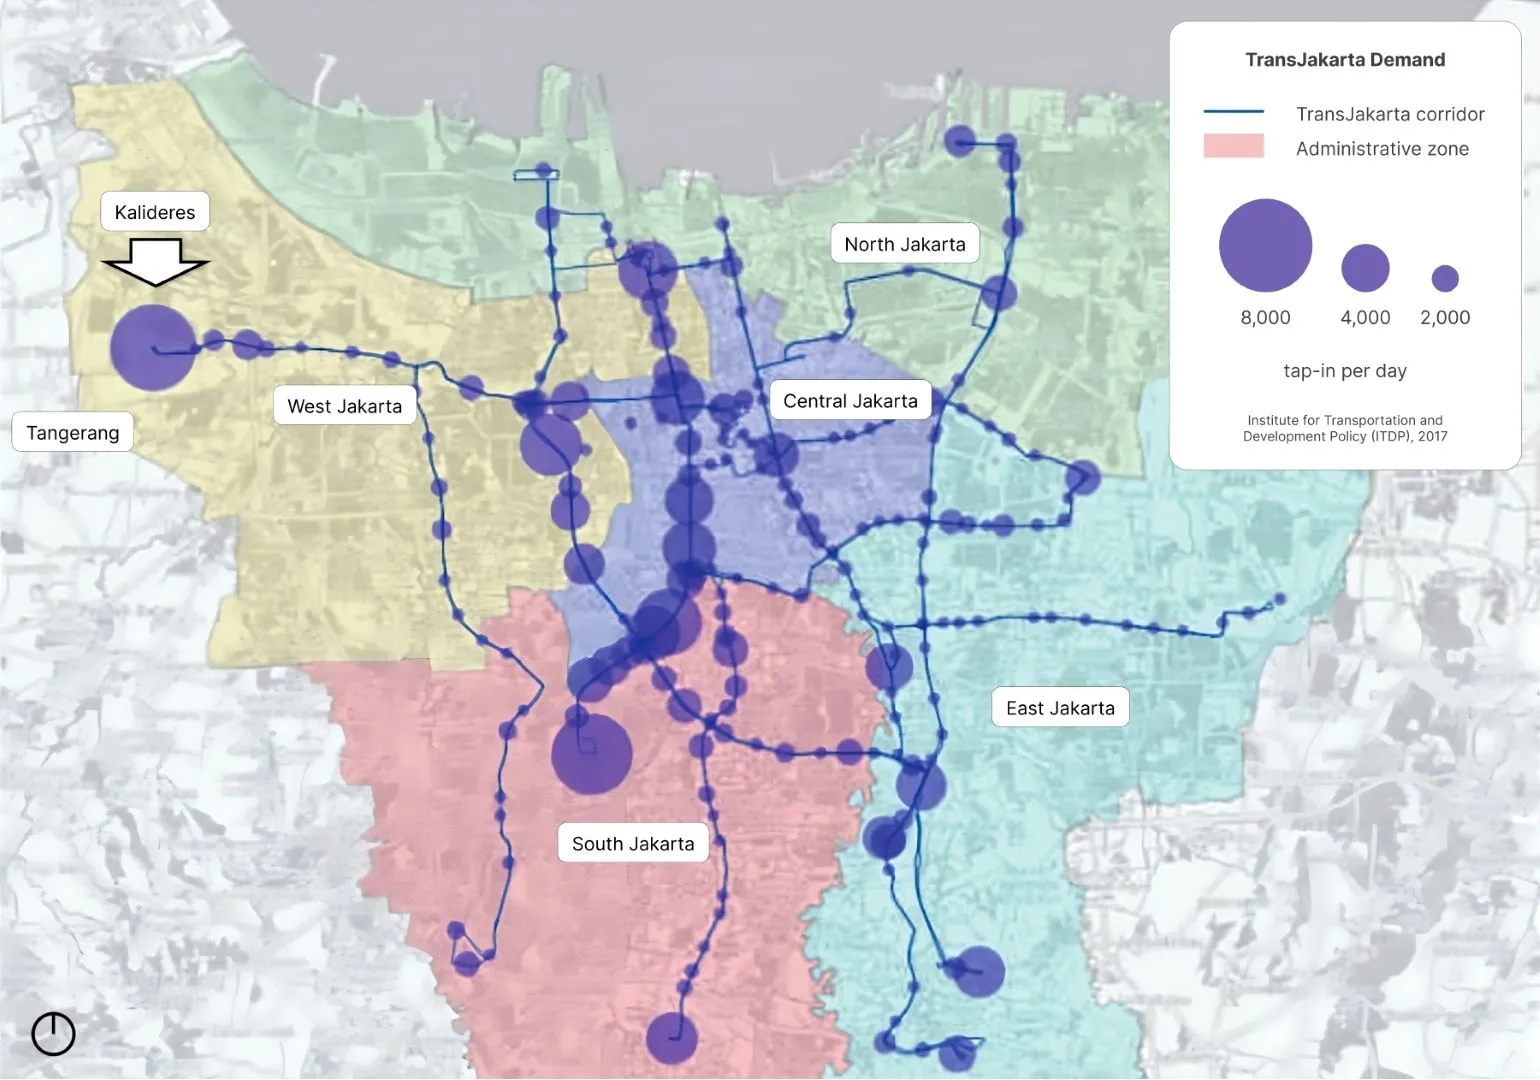
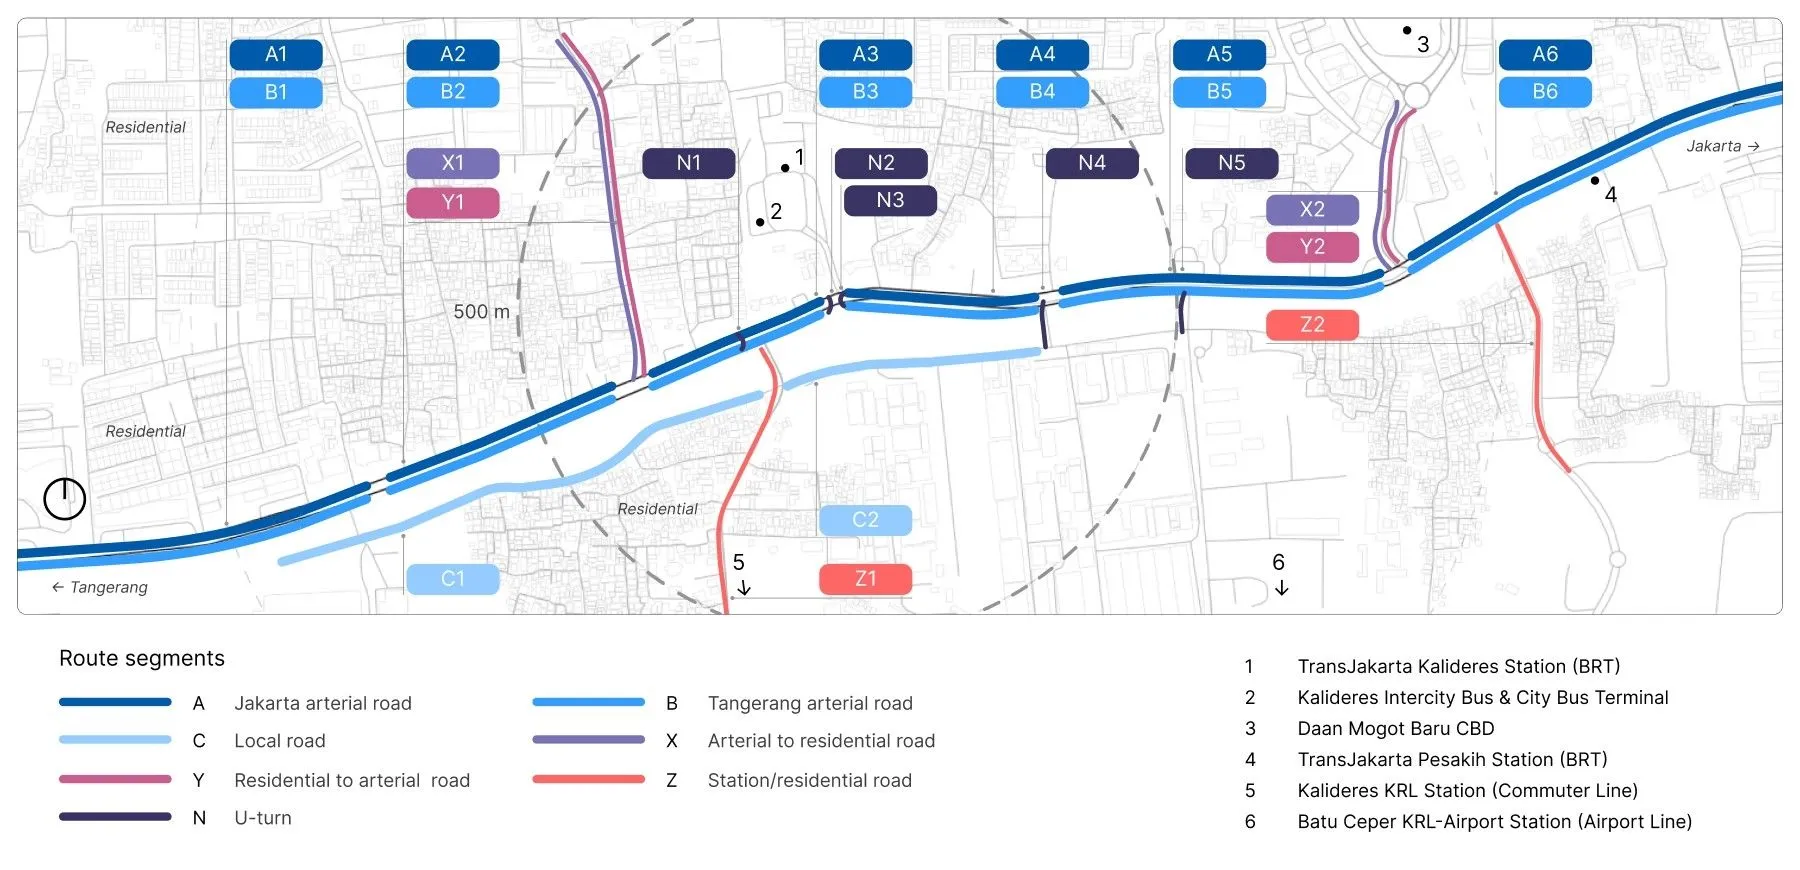
In the context of Kalideres, located in West Jakarta, there is a notable transit volume compared to other regions in Jakarta, as depicted in Figure 1. The area also contends with a dense population, inadequate law enforcement, and a disjointed urban transport system between the Kalideres Terminal and Station.68 Consequently, Kalideres experiences frequent traffic congestion, prolonged vehicle idling, and the presence of unlicensed informal vendors.69 As of June 2022, Kalideres has been officially designated for development into a major transportation hub,70 aiming to establish seamless connectivity to Tangerang City in the west and serve as a crucial transit point for national routes, including those leading to destinations like Sumatra Island and Bali Island via the Indonesian National Route 1, a segment of the Asian Highway 2 (AH2).71 This development holds potential benefits for achieving the research objectives.
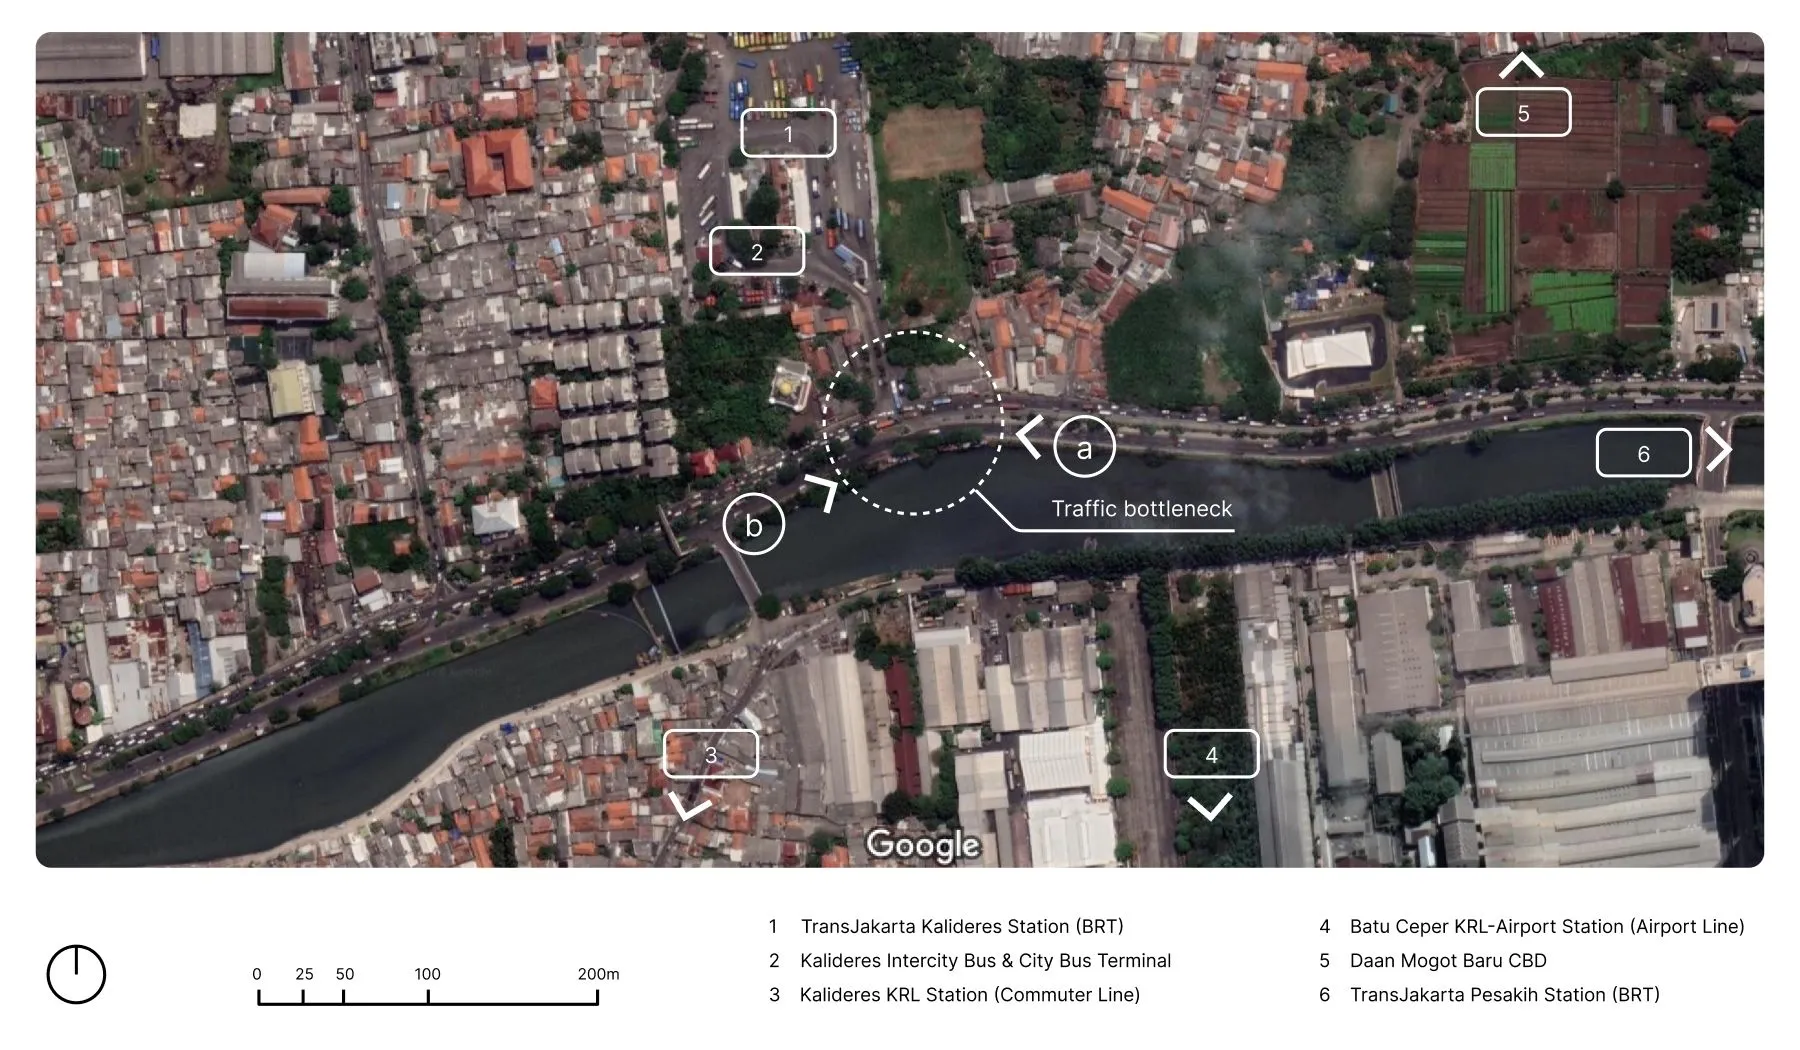
Figure 2 provides a satellite image showcasing Kalideres, highlighting the density of residential areas (including informal and landed housing), commercial zones (ranging from micro to major enterprises), wetlands (such as paddy fields), and transportation systems (including paratransit, traditional, and rapid transit), as well as industrial zones (ranging from small to large-scale industries) overflowing in this area. Additionally, the central terminal’s location underscores the necessity of a proper transit system to accommodate the rapidly growing population.32
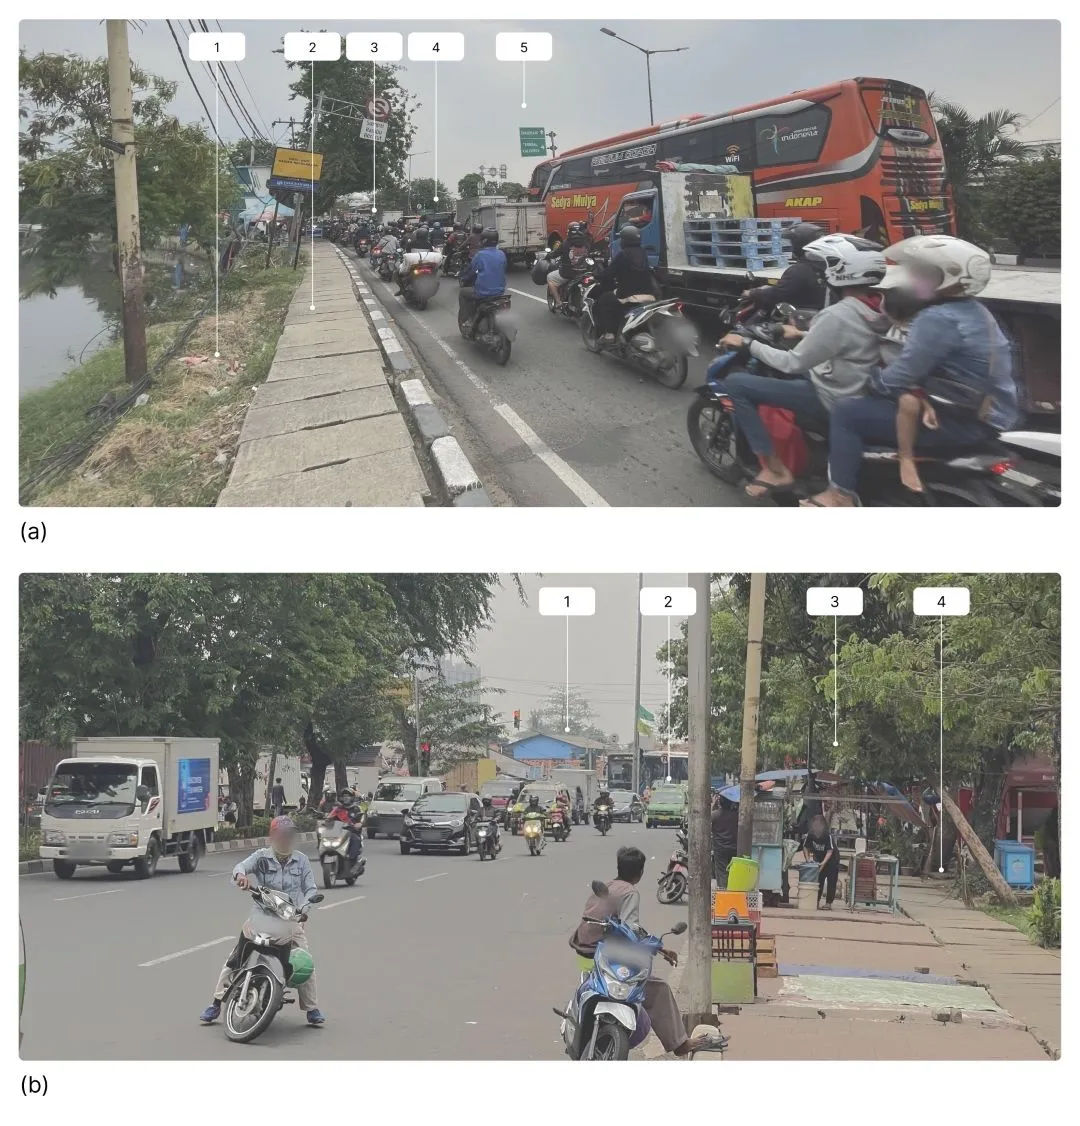
From a connectivity standpoint, arterial roads face congestion due to the mix of pedestrians, private vehicles, and public transport, leading to bottlenecks. Figure 3 illustrates that pedestrian movement is restricted by a car-oriented system implemented in this area, resulting in longer travel distances and durations. This contradicts the principles of walkability advocated by TOD and the sustainable city concept.32,74,75 Therefore, the fundamental need for spacious sidewalks to enhance pedestrian and cyclist movements becomes evident.
2.2. Physical activities and green spaces challenges#
Emergent challenges related to physical activity and green spaces are also evident in Jakarta.76,77 For instance, 65% of pedestrian overpasses remain underutilized.65 Issues such as jaywalking and inadequate urban features at locations like Kalideres Terminal restrict physical activity opportunities and contribute to less stimulating environments, potentially leading to stress and risky behaviors.78 To address these challenges, it is recommended to integrate visual attractions along pedestrian pathways (Routes) to enhance the overall experience and promote healthier behaviors.78 Additionally, implementing TOD principles in areas like Kalideres and prioritizing urban green open spaces (UGOS) can enhance attractiveness and encourage pedestrian activity.
Aligning WM simulations with TOD principles supports the development of UGOS through modeling, indirectly improving transportation efficiency by promoting human-oriented movement and enhancing public health and well-being through increased green spaces.79,80,81 Integrating UGOS with public facilities like commuter rest areas provides socio-economic benefits. As of December 2022, Jakarta had limited public space (PS) and only one transit hub under construction.82 Additionally, the UGOS footprint in Jakarta has decreased to 110.45 km² 83. Therefore, strategically placing UGOS as public spaces at intervals of 400–800 meters based on TOD principles is necessary to ensure community liveliness and well-being.73,84,85
These challenges highlight the importance of further exploring the DML method for WM development. Insights from WM can guide the placement of urban features, particularly public spaces acting as Nodes for rest areas. A comprehensive urban design approach focusing on pedestrian and cycling amenities aligned with TOD principles can help reduce pollution and traffic incidents in the city.86 Analyzing junctions, interactions, and crowd dynamics within WM can uncover patterns to inform advanced modeling methods for addressing challenges at critical intersections.
3. Method#
3.1. Research framework#
The dynamic multi-layer (DML) method is conceptually formulated based on the theoretical framework and the preceding case study. This method employs interconnected dynamic strategies operating layer by layer, with dependencies between sub-layers as depicted in Figure 4. It’s important to note that while the methods outlined are partially contextualized within the selected experimental case study,64,68,69,83,87,88 adjustments may be necessary in different contexts.53 Customization according to the project’s nature, context, or established environment will be highlighted in subsequent paragraphs when relevant.
The DML method provides a solution for cities aiming to plan and design based on best practices in urban planning and design principles. It integrates planning for UGOS and PS to promote healthy urban environments,11,13,80,81,85 focuses on transit hub (TH) placement according to walkability principles in TOD32,67,73,86 and implements physically-oriented linkages between TH and PS with UGOS included for optimized accessibility within TOD radius principles.73,75,85,89 In conclusion, this method cohesively integrates multiple approaches to orchestrate an optimal solution (design guideline).
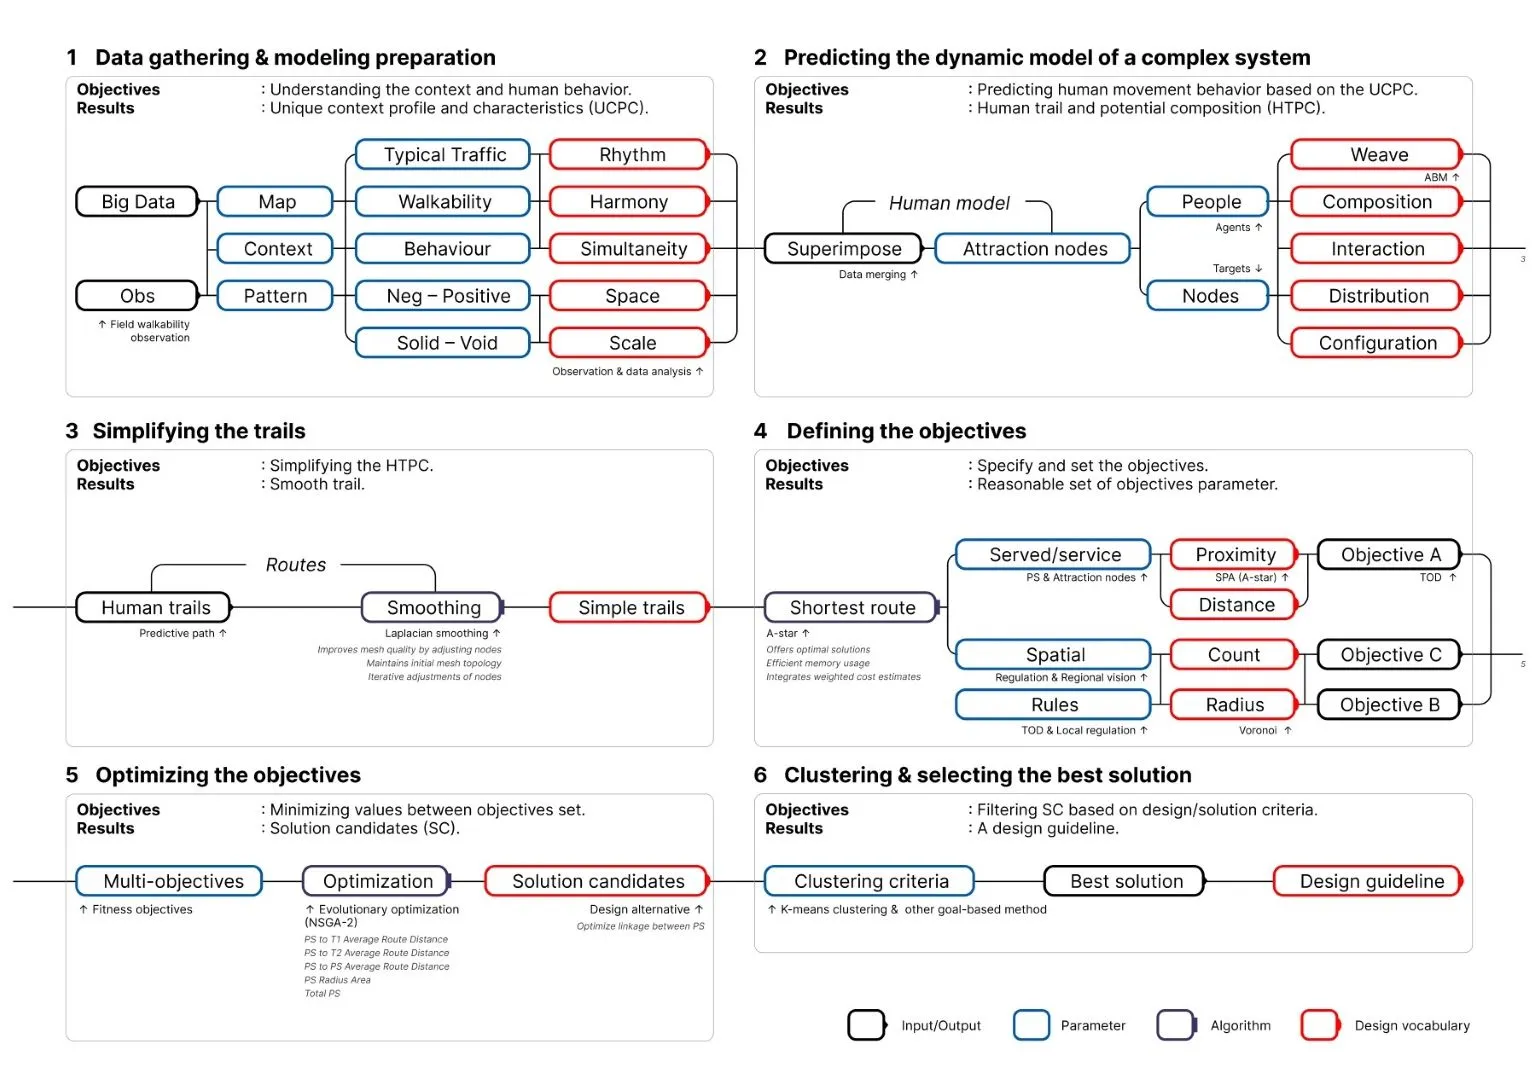
Figure 4 illustrates the six-layer DML approach, with each layer managing distinct input-output data interactions. Subsequent layers build upon insights from previous ones, processing data using predetermined algorithms and parameters. Layers 1 to 4 prioritize walkability data generation, while Layer 5 focuses on simulation and optimization, and Layer 6 manages data clustering based on simulation outcomes. The following overview outlines how the DML addresses the walkability challenge through integrated TH and PS placements, with detailed explanations of each layer’s operation within the selected case study provided in subsequent sections.
- Layer 1: Data gathering & modeling preparation, focuses on understanding the environment and human behavior through detailed data gathering. It establishes a unique context profile and characteristics (UCPC) by considering parameters such as typical traffic,49 walkability, behavior, negative–positive, and solid–void.49,90
- Layer 2: Predicting the dynamic model of a complex system, builds upon Layer 1 and predicts human movement behavior within the environment using dynamic modeling techniques to customize the settings of attraction nodes, generating results referred to as human trails and potential composition (HTPC).50,91
- Layer 3: Simplifying the trails, aims to simplify the complex HTPC generated in Layer 2 for easier interpretation and analysis. It utilizes the Laplacian smoothing algorithm to refine the trails iteratively.57,58
- Layers 4 and 5: Defining and optimizing the objectives. Layer 4 sets clear goals for the optimization process in Layer 5 based on a clear understanding of the context and human behavior. It utilizes the A-star algorithm59,61 for efficient pathfinding92,93,94,95 and defines objective parameters related to people, attraction nodes, PS, spatial formation, and TOD principles. Layer 5 focuses on optimizing the objectives formulated in Layer 4 by minimizing values between refined parameters. It aims to identify solution candidates using the NSGA-2 algorithm.62,63
- Layer 6: Clustering & selecting the best solution, solution candidates undergo clustering and evaluation based on predetermined criteria from Layers 1 to 5. Solutions are considered using various approaches such as Machine-,96 Algorithm-,97 Collaborative-,98 and Context-driven53 methods, guiding the implementation of the most suitable solution for the selected context.99
3.2. Layer 1: Data gathering & modeling preparation#
Layer 1 involved analyzing traffic congestion and pedestrian flow using field walkability observations (Figure 3). Digital tools like Rhino,100 Grasshopper,101 and Caribou102 were utilized to map the environment and create a base map (Figure 5). Observing emergent behaviors, we used crowdsourced data from Google Maps Typical Traffic to track traffic congestion,47,48,103,104 influencing pedestrian movements collected from 6 a.m. to 10 p.m., as shown in Figure 6a.
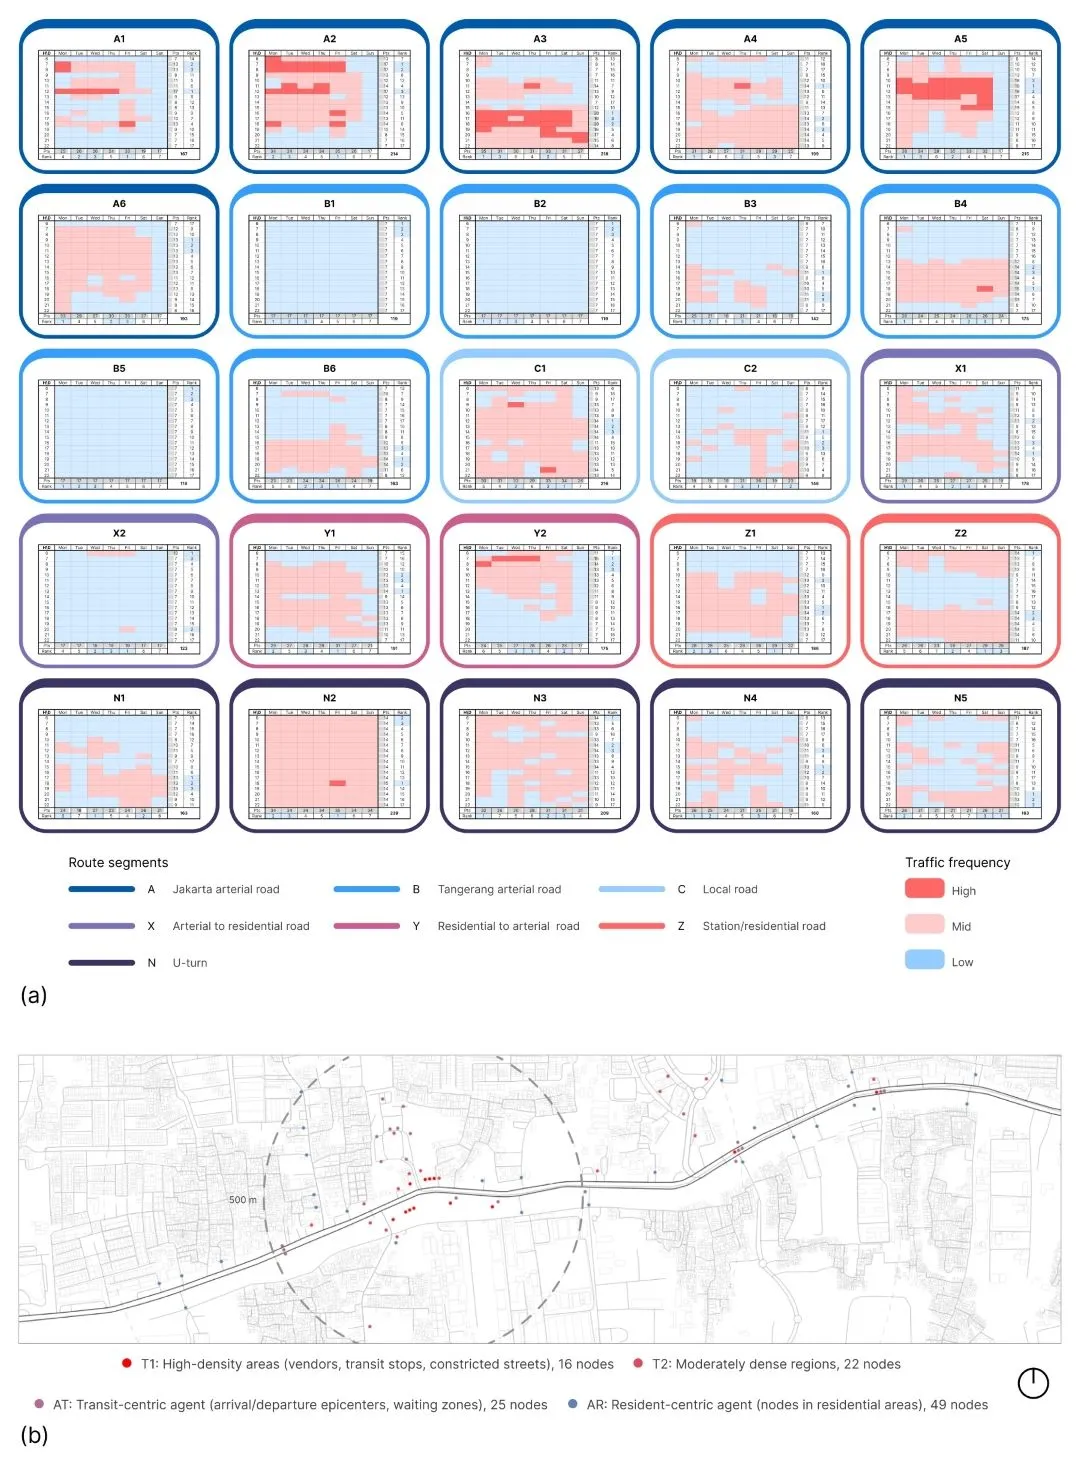
Figure 6a displays Google Maps Typical Traffic data transformed into a ranking schema categorizing traffic densities into three levels: low, moderate, and high. Each route is assigned “Total points” and “Rank” per day per 1-hour timestep, allowing us to identify route segments affected by significant bottlenecks.48 This enables ABMS representation of agents and targets in the environment. Concurrently, Figure 6b depicts:
- T1: Primary target for high-density areas, totaling 16 nodes.
- T2: Secondary target for moderately dense regions, totaling 22 nodes.
- AT: Transit-centric agent for arrival/departure epicenters, totaling 25 nodes.
- AR: Resident-centric agent for nodes from residential areas, totaling 49 nodes.
3.3. Layer 2: Predicting the dynamic model of a complex system#
Layer 2 employs the ABMS framework to predict complex movement patterns. This framework generates representation configurations based on behavior data collected during field walkability observations, creating unique agent configurations for AR, AT, T1, and T2 as informed by Layer 1 insights. Utilizing Grasshopper101 and the open-source framework Quelea,105 the simulation demonstrates the iterative behavioral functionalities of each agent group, as outlined in Table 1. To ensure simulation consistency, Table 2 summarizes the global settings employed for the ABMS.
| Iteration | Agent type | Properties | Setting | |
|---|---|---|---|---|
| Wandering | Align Force | |||
| 1 | Solo Commuting | For students and professionals | Activate | Deactivate |
| 2 | Solo Walking | For leisure walkers | Deactivate | Deactivate |
| 3 | Group Touring | For group tours | Deactivate | Activate |
| Setting | Properties | Value |
|---|---|---|
| Particle Settings | Lifespan | −1 |
| Mass | 50 | |
| Body size | 50 | |
| History length | 500 | |
| Agent Settings | Max speed | 10 |
| Threshold | 2.5 | |
| Vision radius | 50 | |
| Vision angle | 360 (degree) | |
| Emitter Settings | Creation rate | 1 |
| Points (AR) | 49 | |
| Points (AT) | 25 | |
| Quelea (AR) | 10 | |
| Quelea (AT) | 40 | |
| Velocity (AR) | 0.5, 0.5, 0 (vector) | |
| Velocity (AT) | 2, 2, 0 (vector) | |
| System (Particle Rules) | Arrived radius (T1) | 8 |
| Arrived radius (T2) | 13 | |
| System (Agents Rules) | Vision radius multiplier | 0.9 |
| Min time to collision | 9 units | |
| Potential collision distance | 100 units |
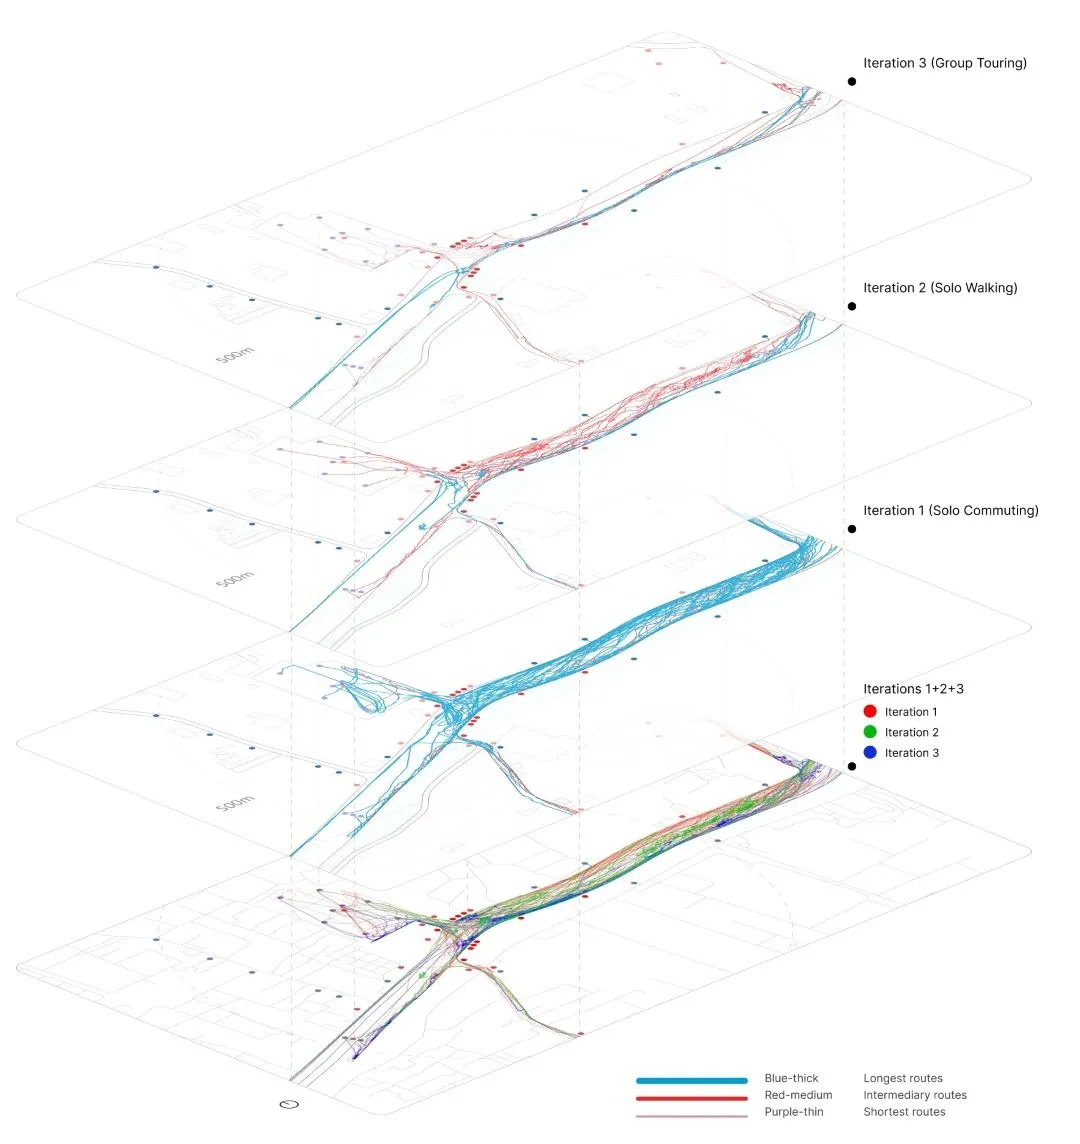
After 300 iterative steps per iteration, Figure 7 presents superimposed results that unveil patterns across iterations. In Iteration 1, agent navigation exhibits a smoother flow. By Iteration 2, agents cluster in bustling zones, and by Iteration 3, dense congregations emerge around areas such as T1 and T2. These dense areas, particularly those near high-traffic zones, become congestion hotspots due to their population density. The simulations also identify primary axes at road segment intersections, providing insights for urban renewal and infrastructure enhancements aligned with walkability principles.
3.4. Layer 3: Simplifying the trails#
Layer 3 abstracts data from three iterations in Layer 2, synthesized in Figure 7 and elaborated in Figure 8. The methodology utilizes the Laplacian smoothing technique,57,58 originally developed by Field55 and refined by Pryor and Zwierzycki,106 focusing on average calculations of nearby nodes. Its algorithm includes:
- Maintaining consistent spacing of 25m between nodes along curve trails.
- Identifying uniformly segmented spaces as modifiable modal points.
- Categorizing modal points based on their position: start, end, or intermediate nodes.
- Iteratively adjusting intermediate nodes using a loop method based on their relative positions and average values,107 simulating magnet-like behavior with the loop algorithm from Anemone.108
- Choosing the final outputs, known as smoothed curve trails, to preserve essential data while avoiding excessive refinement.
Figure 8 illustrates the algorithm procedure, particularly spotlighting the 10th iteration for its well-maintained balance between the original trail’s complexity and simplicity. In this stage, the primary trails begin to blend harmoniously with the environment, paving the way for further analysis in the subsequent layer. The next layer concentrates on defining mesh space through the shortest path algorithm (SPA), in line with TOD Standard 3.073 and Sustainable Development Goal 11,109 highlighting urban design enhancement and resilient transportation infrastructure.
3.5. Layers 4 and 5: Defining and optimizing the objectives#
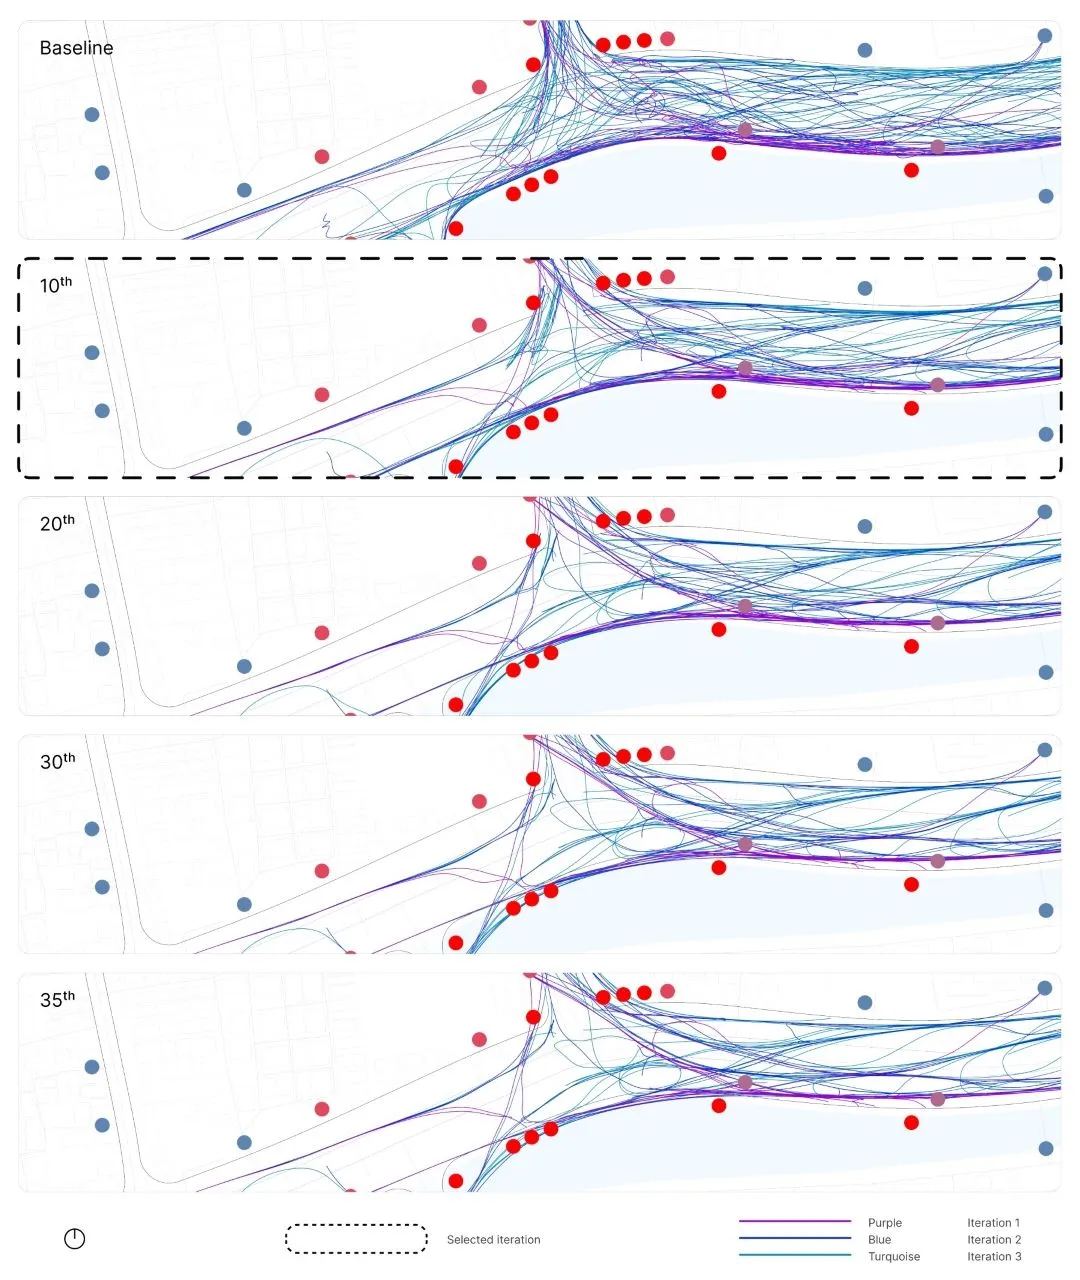
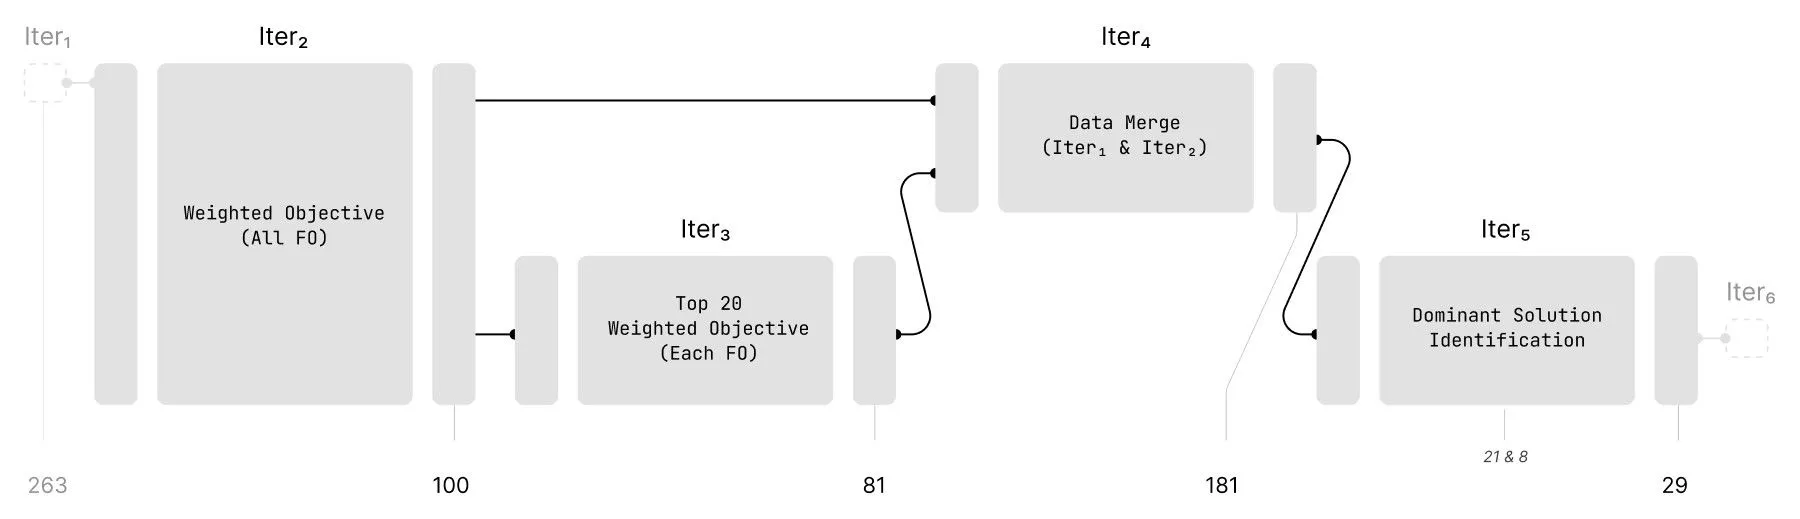
Layers 4 and 5 synergize to optimize solution candidates effectively. Layer 4, depicted in Figure 9, illustrates the evolution of simplified trails across six iterations. Its algorithmic steps include:
- Smoothing the simple trails to rationalize geometries for faster calculations.
- Offsetting all curves to create a bounding box for the outer boundary of trails.
- Further simplifying the trails to ensure consistency and computational efficiency.
- Utilizing simplified boundary lines to generate a triangulation mesh for graph preparation for the shortest path algorithm (SPA).
- Transforming the triangulation mesh into a mesh of near-equilateral triangles using the TriRemesh component from Kangaroo2.110
- Simulating the shortest path using the A-star algorithms for SPA, including graphs for the path, start and end points, and employing the shortest path component from Arachne111 for simulation.
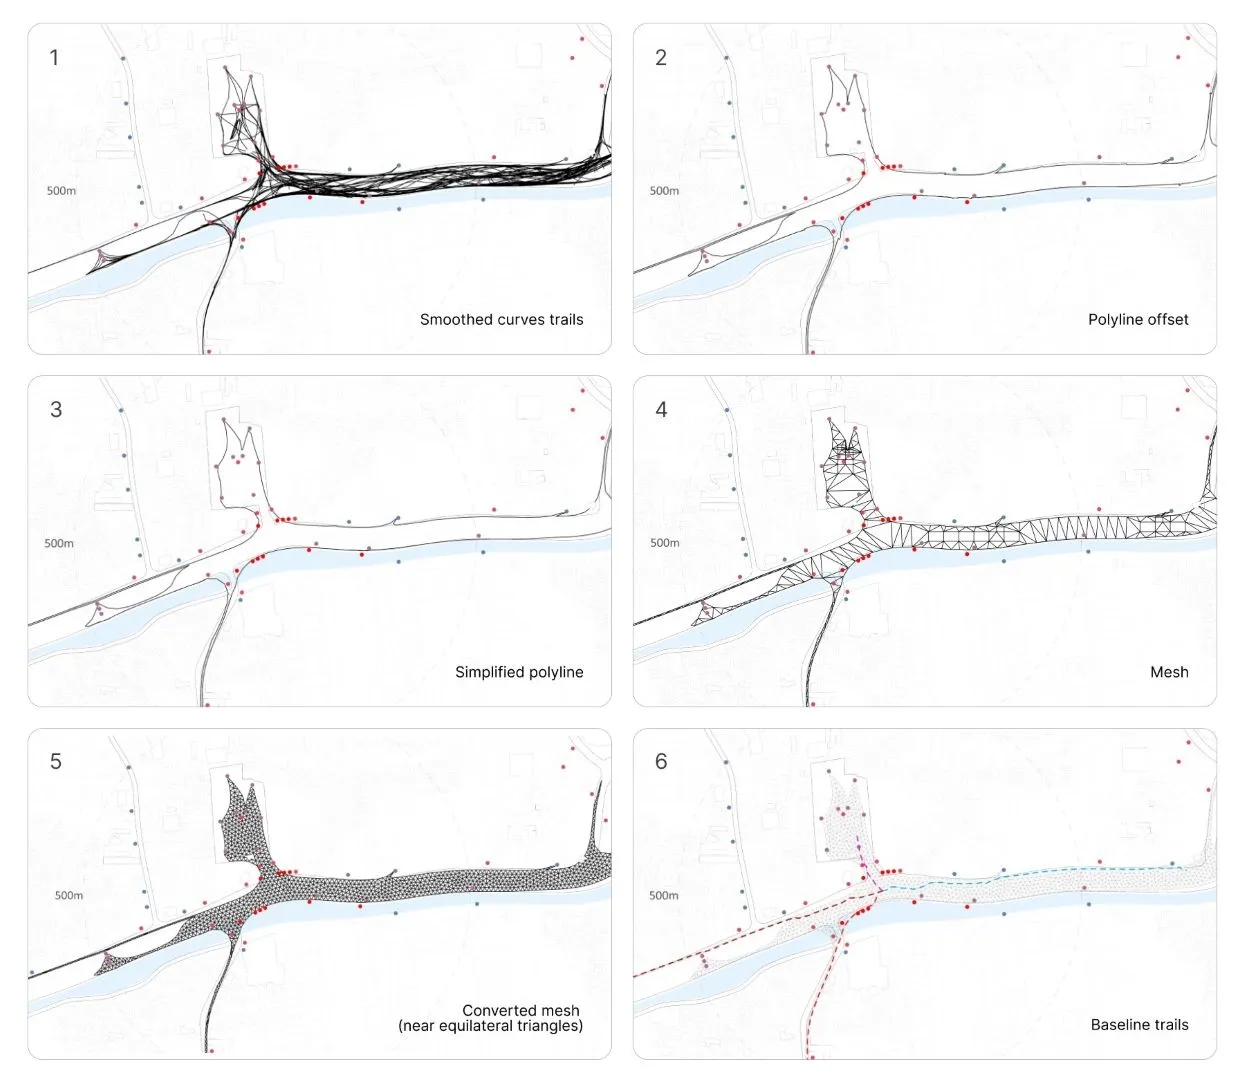
After iterative refinement, the baseline trails have the potential to evolve into optimal routes, enhancing walkability and aligning with TOD and Sustainability Development Goals principles. These optimized routes play a crucial role in improving physical activities and upgrading public transportation in densely populated areas. As mentioned earlier, the design objectives will focus on promoting the use of PS and integrating them with UGOS, guided by the baseline trails segmented by length. It is noteworthy that in this experiment, the start point functions as the TH, serving as a central coordinate (the intersection), while intermediate and end points serve as PS coordinates, providing resting areas for commuters. Additionally, the function of this objective can be adjusted based on context, while in this study, only the functions TH and PS are utilized.
In Layer 5, the primary objective is to conduct an EMOO using NSGA-2 algorithm62,63 to identify the best solutions in line with walkability principles. The fitness objectives (FO)112 detailed in Table 3, along with considerations outl ined in Table 4, are crucial for determining optimal positions for PS aligned with TH central points and evaluating their compatibility with the environment. Integrated PS with UGOS113 can serve as Nodes or places for placemaking, enhancing community interaction and well-being, while Routes act as transit stops for facilitating smooth mobility and efficient transportation systems.2,114,115
| FO | FO Definition | Metric |
|---|---|---|
| 1 | Average PS to T1 route distance | Coordinate to coordinate (m) |
| 2 | Average PS to T2 route distance | Coordinate to coordinate (m) |
| 3 | Average PS to PS route distance | Coordinate to coordinate (m) |
| 4 | Total Voronoi area (500m from PS) | Area of Voronoi radii (m²) |
| 5 | Total PS | Total count (number) |
| Objectives | FO1 | FO2 | FO3 | FO4 | FO5 |
|---|---|---|---|---|---|
| Enhancing visual attractions78 and walkability principles1,3 | D | D | D | D | D |
| Managing transit volume,7 reducing vehicle idling, and controlling informal vendors69* | M | M | M | M | D |
| Reducing commute times18 and lessening cardependence17 | D | D | I | I | I |
| Utilizing pedestrian infrastructure65 and reducing jaywalking64* | D | D | D | M | D |
| Enhancing transit connectivity1,2,3,4,5 and reorganizing facilities32 | D | D | D | M | D |
| Promoting a healthier city4,12 and improving physical activity1,2,3,4,5 | D | D | D | D | D |
| Implementing public space as a low-cost local strategy11 and connecting it to TH68 | I | I | I | M | D |
The genes116 for this simulation are constructed based on distances between potential TH and PS coordinate points, following TOD Standard 3.0 benchmarks.73 These distances range from 300m to 500m in 10m intervals. After formulating the FO and genes, the EMOO is executed using customized settings detailed in Table 5.
| Parameter | Value Property | Value |
|---|---|---|
| Population Settings | Population Size | 2,500 |
| Population Count | 50 | |
| Population Size | 50 | |
| Algorithm Parameters | Crossover Probability | 0.9 |
| Mutation Rate | 1/n | |
| Mutation & Crossover Distribution Indices | 20 | |
| Random Seed | 1 | |
| Simulation Parameters | No. of Genes (Sliders) | 9 |
| No. of Values (Slider Values) | 189 | |
| Max No. of FO | 5 |
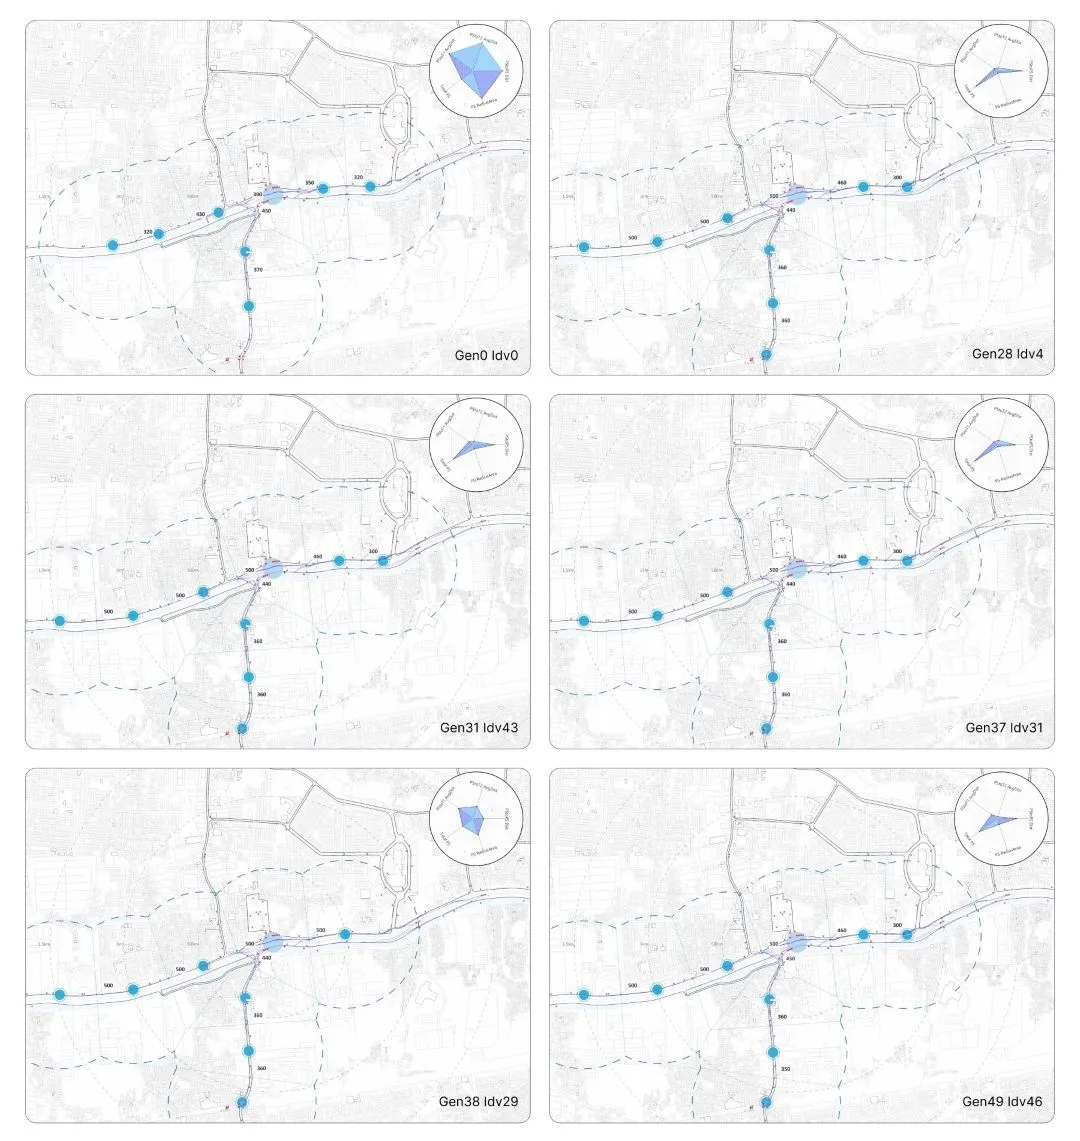
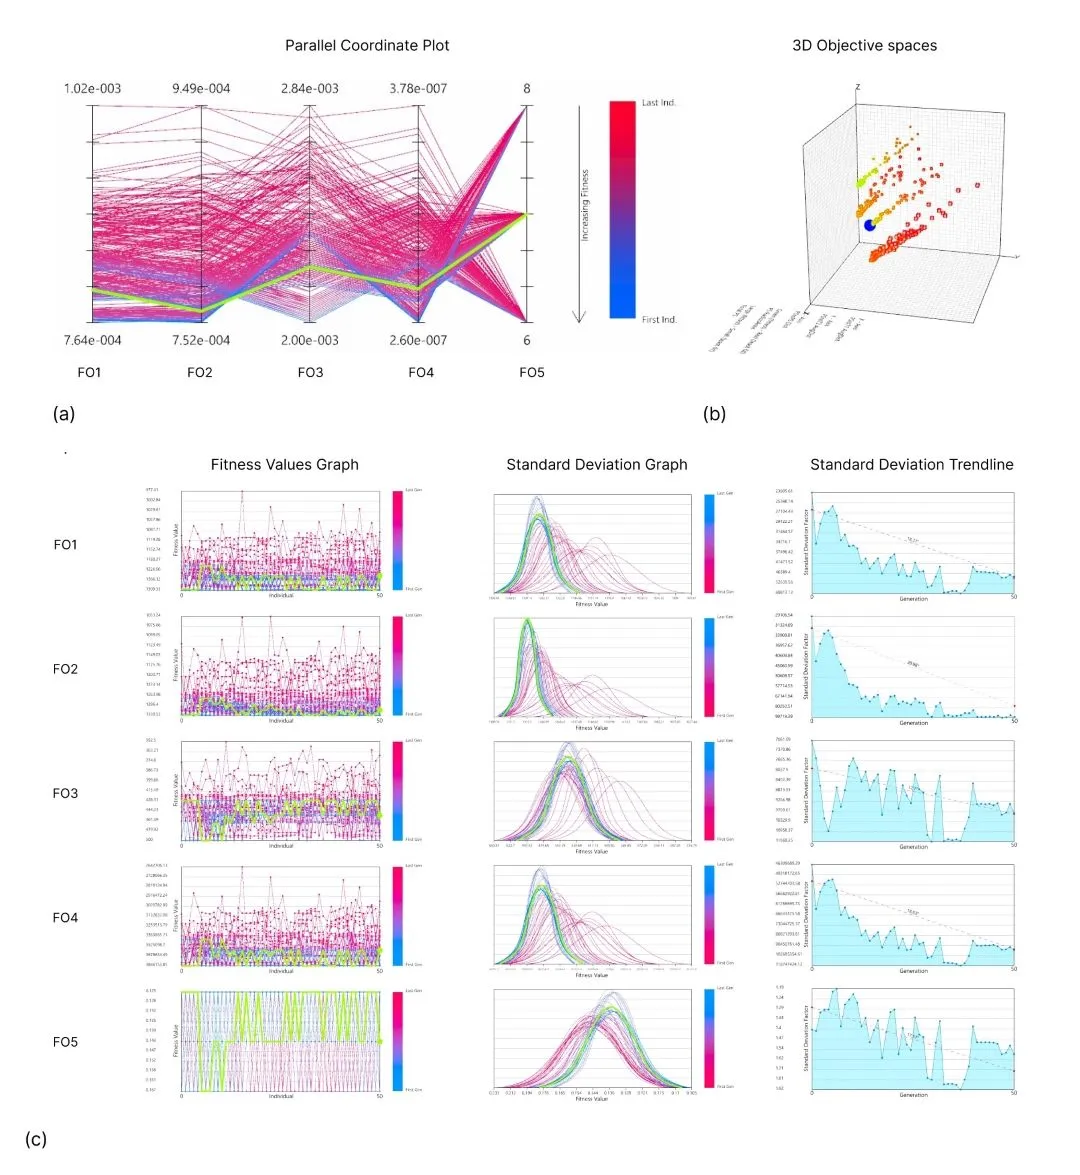
Upon simulating with the settings in Table 5 (results shown in Figure 10), the evaluation utilizes Wallacei’s features116, including the Parallel Coordinate Plot (PCP), Standard Deviation Graph (SDG), and Fitness Value Graph (FVG). Figure 11 illustrates consistent results:
- Most FO values converge, except for FO5, showing tolerable fluctuations due to minor variations in observed PS numbers, as seen in the PCP and SDG.
- The 3D objective space indicates the Pareto front’s movement toward coordinates (0,0,0) with each simulation generation.116
- The EMOO and analysis confirm the effectiveness of the evolutionary method in generating numerous solutions from a vast search space. The simulation’s efficiency is highlighted by a runtime duration of about 23mins and 42s.
With this comprehensive data, the next layer will employ solution clustering using ISOA techniques to select the best solution as a design guideline.99
3.6. Layer 6: Clustering & selecting the best solution#
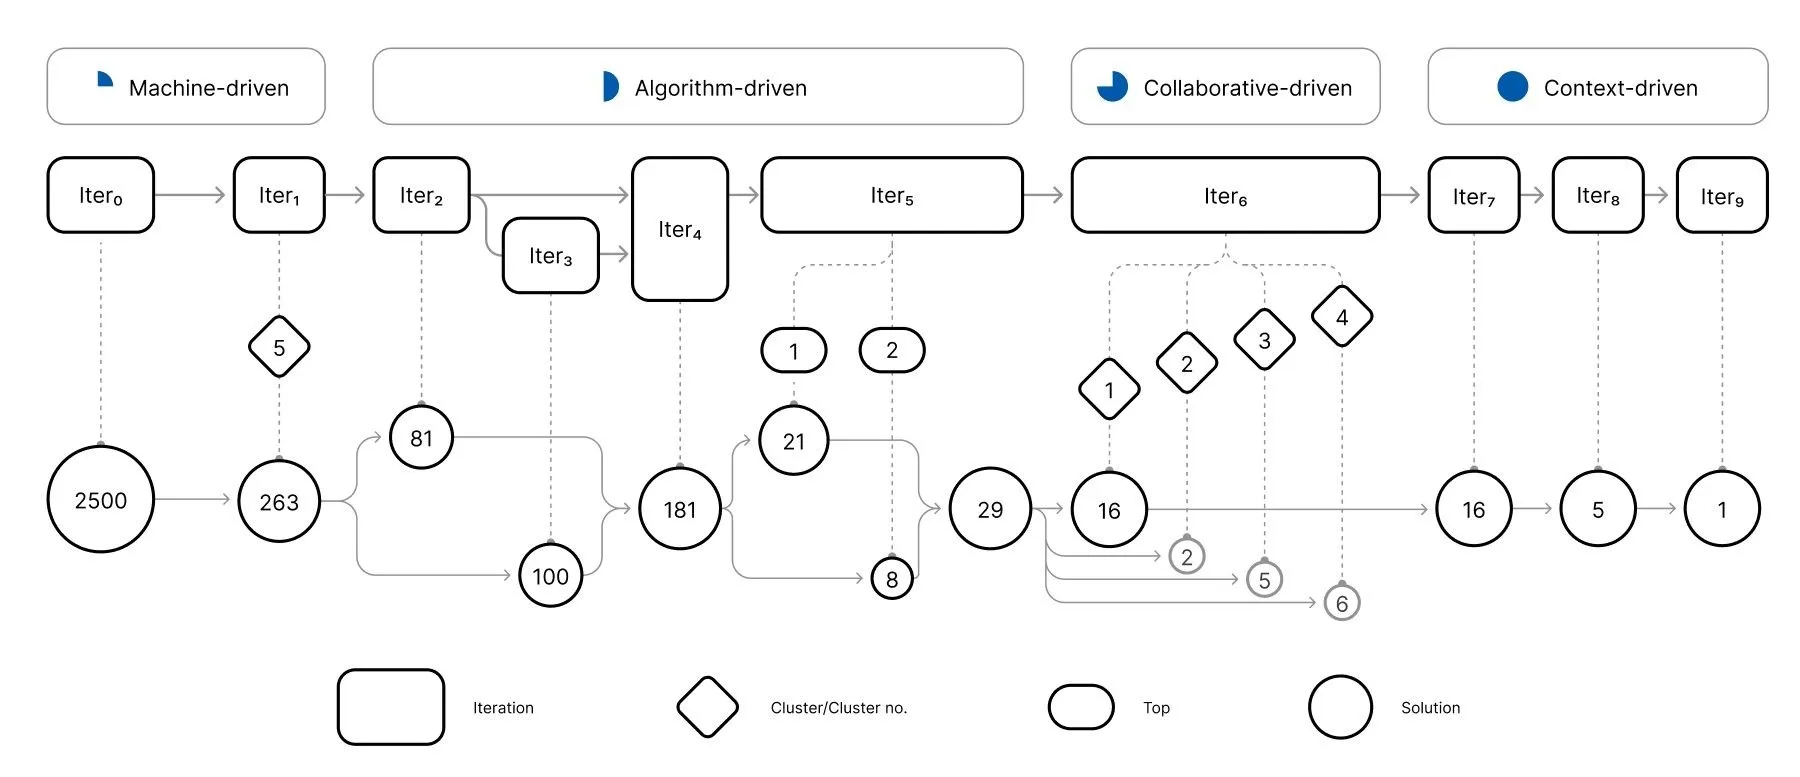
Layer 6 compiles the solution candidates output from Layer 5 and iterates them into the best optimal solution using the iterative solution optimization approach (ISOA) as a future design guideline. Figure 12 shows how ISOA combines four methods: Machine-, Algorithm-, Collaborative-, and Context-driven. The detailed ISOA formulations are outlined in Table 6, highlighting their objectives and flexibility in adapting to various problem contexts. We utilize Machine-driven solutions with Wallacei’s analytical features with customizable parameters, while Algorithm-driven solutions are based on Rhino & Grasshopper and can be adjusted parametrically. Collaborative- and Context-driven solutions are developed in Microsoft Excel as needed.
| Approach | Iteration | Objective | Tools |
|---|---|---|---|
| Machine-driven | Iter₀ | Evolutionary simulation in Layer 5 generates solution candidates (Figure 11). | Rhino, Grasshopper, Wallacei |
| Iter₁ | K-means clustering algorithm segments solutions from Iter₀ into five clusters (Figure 13). | Rhino, Grasshopper, Wallacei | |
| Algorithm-driven | Iter₂ | Assigns index scores to FO solutions from Iter₁ based on prioritization in the given context (Figure 14). | Rhino, Grasshopper |
| Iter₃ | Highlights the top 20 values for each objective solution from Iter₂ (Figure 14). | Rhino, Grasshopper | |
| Iter₄ | Merges data output from Iter₂ and Iter₃ (Figure 14). | Rhino, Grasshopper | |
| Iter₅ | Identifies top domination solutions from Iter₄ (Figure 14). | Rhino, Grasshopper | |
| Collaborative-driven | Iter₆ | Identifies new visual clusters based on FO recognition from Iter₅ solutions using DF charts (Figure 15). | Microsoft Excel |
| Context-driven | Iter₇ | Select the highest-scored indexed visual cluster from Iter₆ solutions using the same indexing method as Iter₂ (Figure 16). | Microsoft Excel |
| Iter₈ | Customizes indexing based on route length in the first radius of TOD and calculates it for Iter₇ solutions (Figure 17). | Microsoft Excel | |
| Iter₉ | Recalculates output from Iter₈ to find a design guide with customized indexing based on route length, aiming to discover the best routes to the main traffic based on potential TOD connectivity, specifically the South Route (Figure 17 and Figure 18). | Microsoft Excel |
3.6.1. Machine-driven methods#
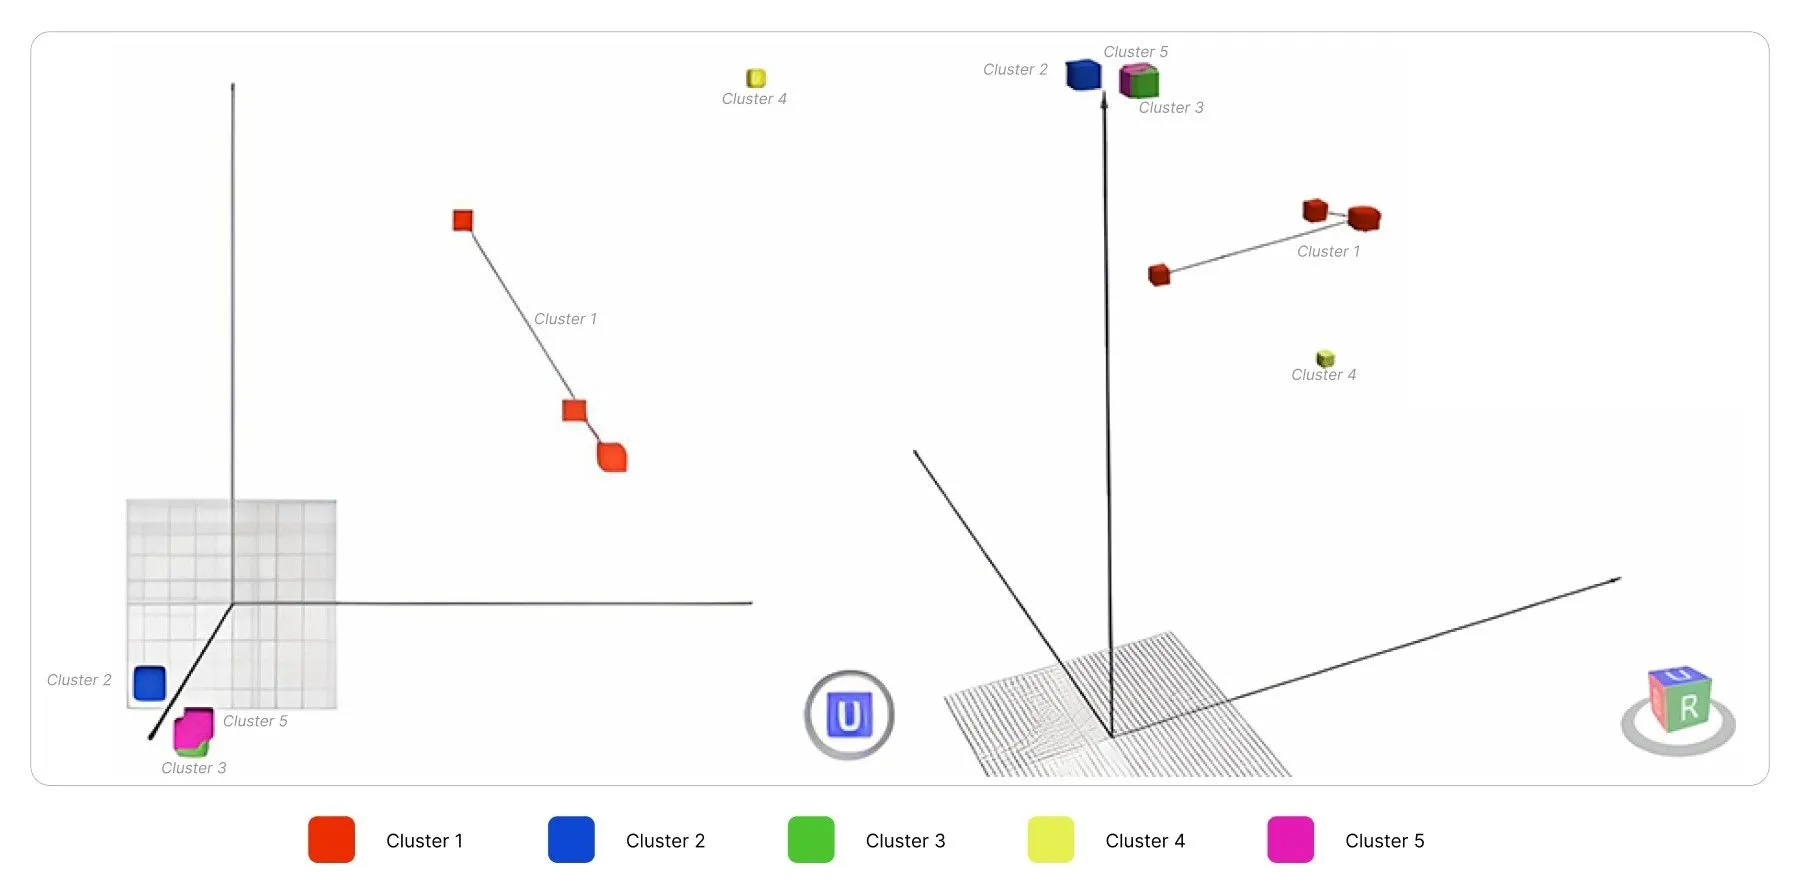
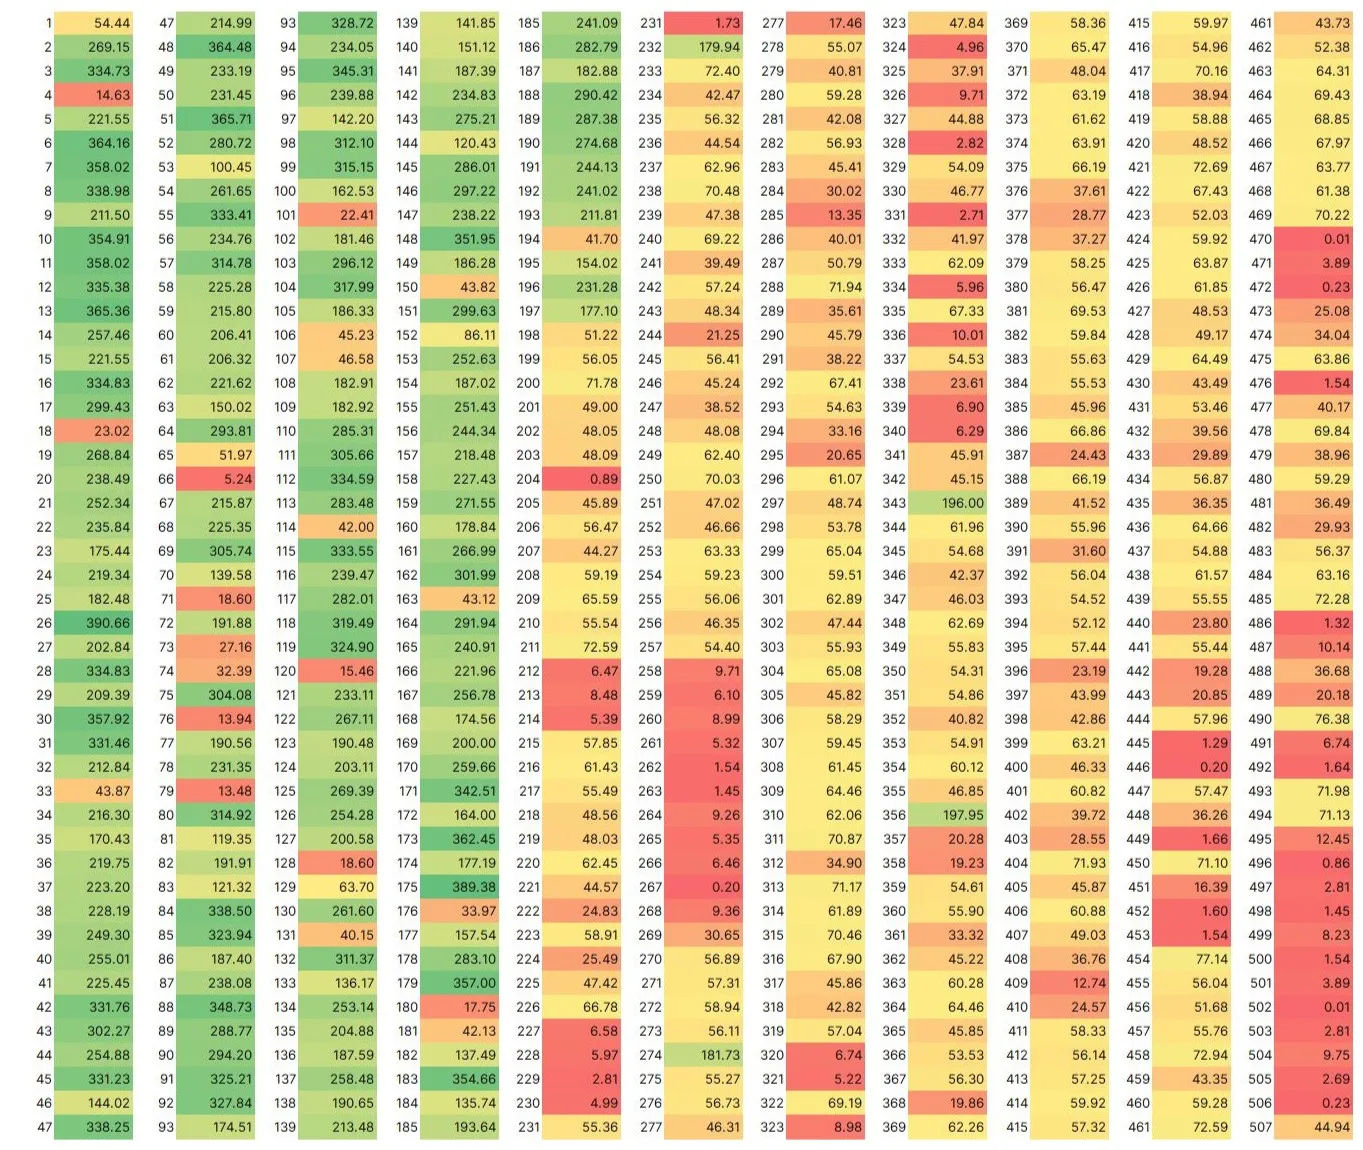
In this approach, Iter₀ consists of solution candidates from Layer 5, optimized through EMOO, resulting in 2,500 solutions. Figure 13 shows Iter₁, where the K-means clustering algorithm is applied to Iter₀, generating five clusters based on solution characteristics, resulting in 263 solutions distributed across these clusters.
3.6.2. Algorithm-driven methods#
In this approach, the progression through four stages, as referred to in Figure 14, is described as follows:
- In Iter₂, 263 solutions from Iter₁ are analyzed based on five FO functions (), each with a specific weight distribution () as outlined in Table 3 and Table 4. The equation for Iter₂ is , resulting in 81 solutions.
- Iter₃ focuses on the top 20 values for each of the five objective functions, leading to and the selection of 100 potential solutions, of which 56 are unique.
- Iter₄ combines data subsets from Iter₂ and Iter₃ to create an integrated set of 181 solutions. Finally, Iter₅ identifies recurring index values as “dominant solution” values from the 181 solutions, resulting in a refined list of 29 solutions using .
3.6.3. Collaborative-driven methods#
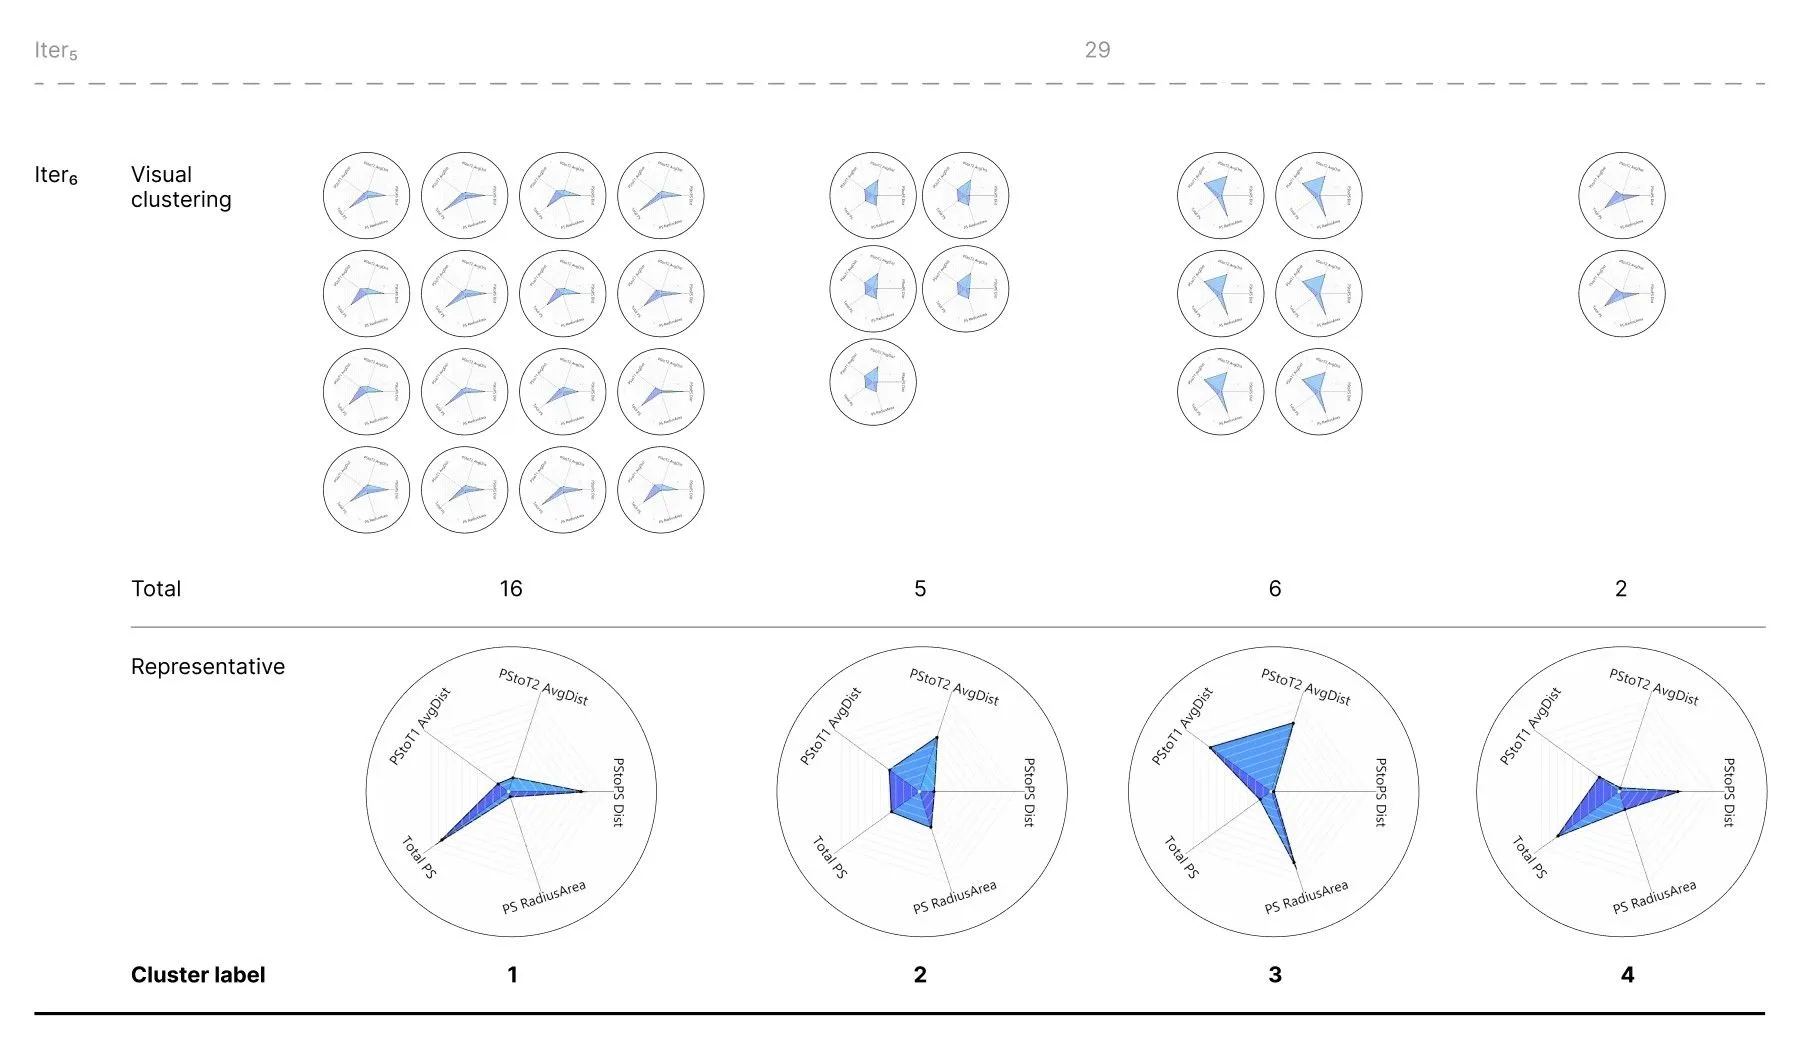
In this approach, Iter₆ evaluates the 29 solutions from Iter₅ by visually categorizing them using DFC radar plots to establish clusters. Figure 15 illustrates how each solution is grouped based on visual similarities in objective patterns, resulting in the identification of four distinct clusters.
3.6.4. Context-driven methods#
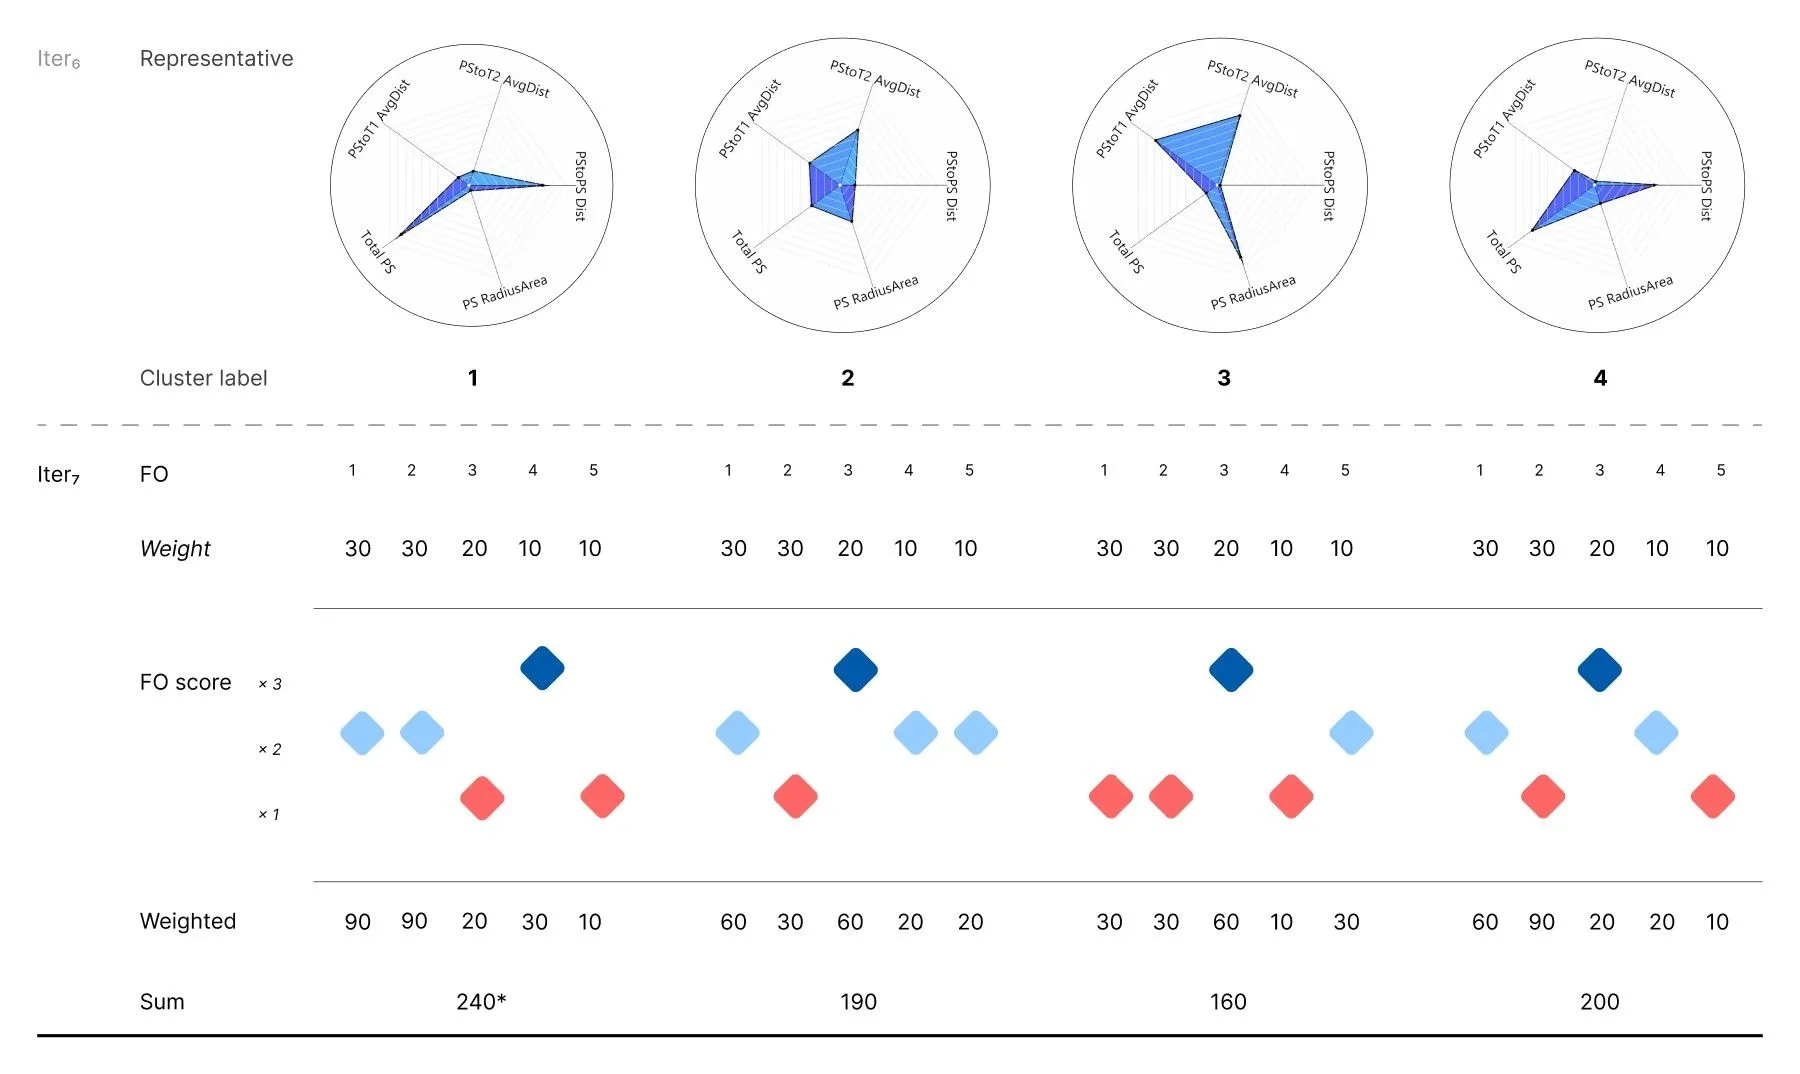
In this approach, Iter₇ identifies the dominant cluster from Iter₆. Figure 16 demonstrates the application of a customized weight formula for each FO, similar to the customized weighted considerations in Iter₂. The weights assigned to Clusters 1 to 4 are: 240, 190, 160, and 200. An asterisk value after 240 indicates the primary cluster with the highest cumulative sum of weights among all clusters.
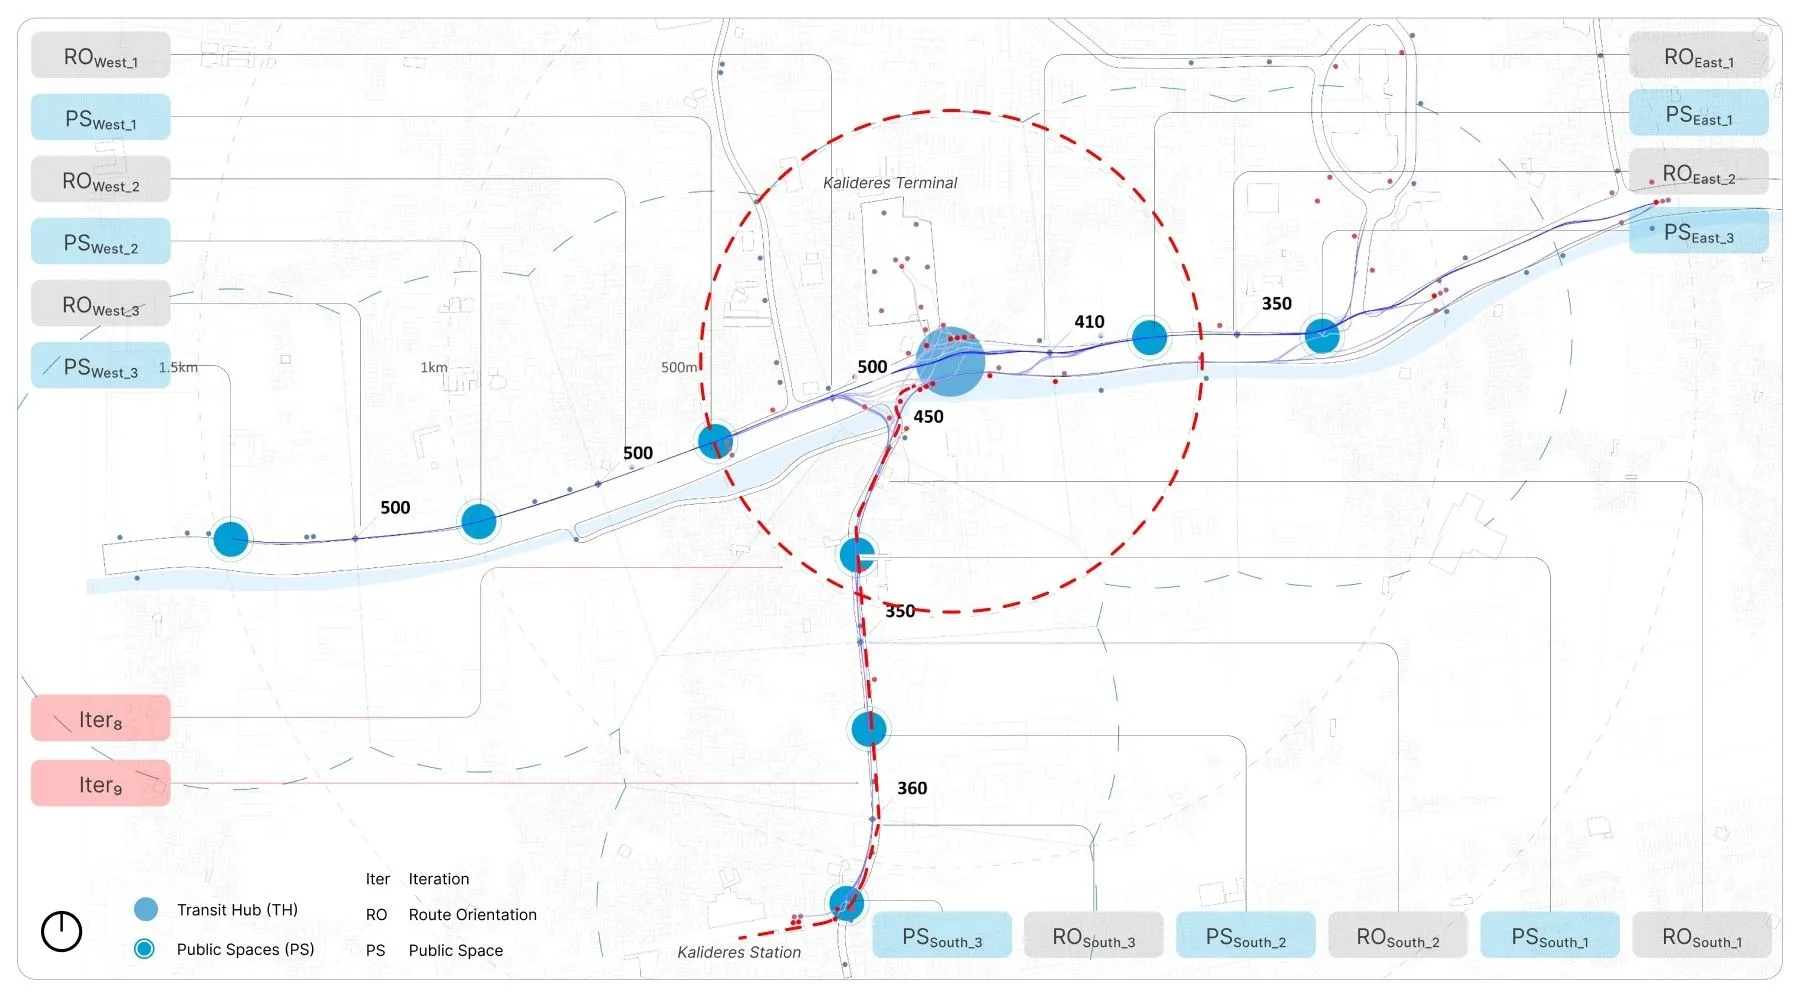
In Iter₈, each direction (east, south, and west) is assigned a route orientation (Routes) to measure distances between specific points using coordinates from Figure 17. The weighted route orientation () is calculated as , where represents the weight assigned to Routeₙ. The weight distribution () for the route orientations is [0.50, 0.20, 0.30] for east, south, and west directions, respectively. The sum of weighted route orientations in Table 6 is denoted as . Based on this calculation, the last five solutions with a score of 402 are selected for the subsequent Iteration, Iter₉ (Table 7).
| Gen | Idv | |||||||
|---|---|---|---|---|---|---|---|---|
| 17 | 5 | 460 | 440 | 500 | 230 | 88 | 150 | 468 |
| 18 | 4 | 460 | 440 | 500 | 230 | 88 | 150 | 468 |
| 19 | 9 | 440 | 460 | 500 | 220 | 92 | 150 | 462 |
| 19 | 11 | 440 | 460 | 500 | 220 | 92 | 150 | 462 |
| 21 | 12 | 440 | 460 | 500 | 220 | 92 | 150 | 462 |
| 22 | 16 | 440 | 460 | 500 | 220 | 92 | 150 | 462 |
| 23 | 10 | 450 | 460 | 500 | 225 | 92 | 150 | 467 |
| 23 | 14 | 440 | 460 | 500 | 220 | 92 | 150 | 462 |
| 23 | 16 | 440 | 460 | 500 | 220 | 92 | 150 | 462 |
| 24 | 19 | 440 | 460 | 500 | 220 | 92 | 150 | 462 |
| 27 | 34 | 450 | 460 | 500 | 225 | 92 | 150 | 467 |
| 46 | 40 | 410 | 450 | 500 | 205 | 90 | 150 | 445* |
| 47 | 0 | 410 | 450 | 500 | 205 | 90 | 150 | 445* |
| 47 | 30 | 410 | 450 | 500 | 205 | 90 | 150 | 445* |
| 47 | 47 | 410 | 450 | 500 | 205 | 90 | 150 | 445* |
| 48 | 7 | 410 | 450 | 500 | 205 | 90 | 150 | 445* |
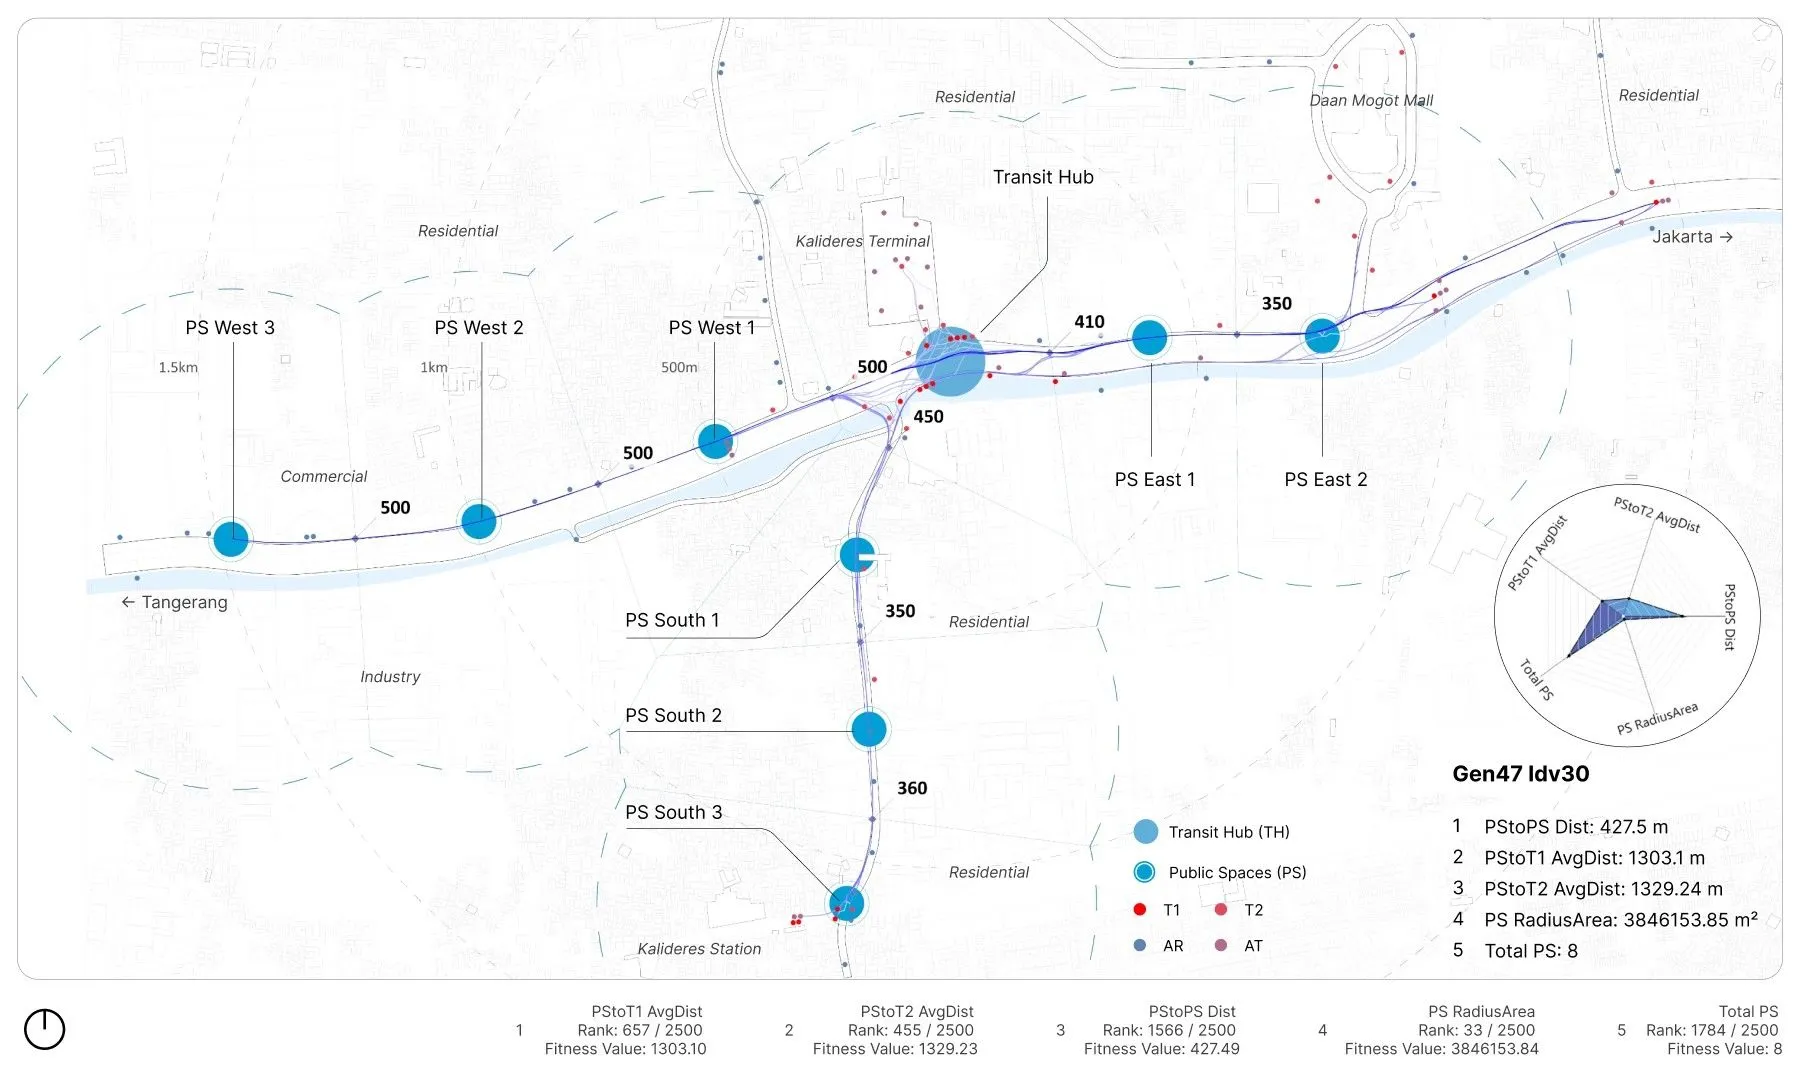
In Iter₉, southern transit routes (Routes) are optimized using coordinates from Figure 17. The south weight distribution () for route orientations is [0.50, 0.30, 0.20] for south₁ to south₃ directions respectively. The sum of weighted route orientations in Table 8 is denoted as . Solutions Gen46 Idv40 and Gen47 Idv30 with a score of 402 are selected due to their lowest score. Figure 18 illustrates one of these solutions meeting the set goals for each FO, serving as a leading design guideline for future TH and PS planning. (Note: Gen46 Idv40 and Gen47 Idv30 refer to the same solution with identical genes and FO values.)
| Gen | Idv | |||||||
|---|---|---|---|---|---|---|---|---|
| 46 | 40 | 450 | 350 | 360 | 225 | 70 | 108 | 402* |
| 47 | 0 | 450 | 360 | 350 | 225 | 72 | 105 | 403 |
| 47 | 30 | 450 | 350 | 360 | 225 | 70 | 108 | 402* |
| 47 | 47 | 450 | 360 | 350 | 225 | 72 | 105 | 403 |
| 48 | 7 | 450 | 360 | 350 | 225 | 72 | 105 | 403 |
4. Discussions#
This study aims to explore the connection between walkability and physical activity in urban settings, focusing on developing a novel walkability model using our proposed DML approach. It emphasizes the importance of improving walkability by optimizing pedestrian pathways referred to as “Routes” and considering TH and PS as “Nodes.” Understanding how the built environment influences physical activity is essential, emphasizing the use of innovative methodologies. The main findings from the DML method experimentation are as follows: First, utilizing the DML method, this study proposes solutions to abstract city problems, especially in rapidly urbanizing areas. This enhances the understanding of factors influencing pedestrian behavior and urban design, contributing to the field of urban and built environment studies. The research utilizes ABMS and field observations, supported by tools like Google Maps Typical Traffic, to provide initial insights into WM. Field walkability observations play a crucial role in predicting and understanding context and characteristics, essential for capturing each city’s unique attributes, as illustrated in Figure 2 and Figure 3.
Second, regarding modeling techniques and optimization, integration is achieved through the DML method, as depicted in Figure 4. This method follows a sequential process, starting with Layer 1 for data transition and involving the preparation of maps from crowdsourced data. It progresses through Layers 2 to 4 for modeling the crowds to decide on a formulation of objective definition and extends to Layer 5 for optimization, encompassing most of Layer 6, specifically machine- and algorithm-driven approaches. This integration takes place within a single simulation environment, specifically Grasshopper, as detailed in the Method section.
However, challenges arise when quantifying data from non-computational sources, especially when converting intangible data from field walkability observations (early phase, Figure 2 and Figure 3) and defining behavioral settings for ABMS. The process of merging this data into the ABMS environment, mapping out aspects like people, vehicles, and urban features, is crucial for creating a walkability model (WM) with representative numeric quantitative data for simulation, as demonstrated in Table 1 and Table 2. It requires a sensitive analysis of movement and behavior within the context.
Decisions aimed at results, determining when to start, pause, and stop the smoothing processes, are crucial. These decisions should aim to simplify complex trails from ABMS and reveal the major and minor axes emerging from the pre-simplified trails, as illustrated in Figure 7. In the final phase, clustering relies on reasonable rationale to accommodate wide, complex, and extensive contextual preferences, resulting in the method not being fully automated. However, this nature allows for customizing the ISOA method shown in Figure 12, providing each context with a unique clustering solution.
Additionally, EMOO enables users to adjust or iterate on biases and conflicting objective outputs observed during simulation runs, aiding in identifying the most suitable values among conflicting objectives. This is depicted in Figure 11, where NSGA-2, in this case, can provide the best 2500 options from approximately 790 billion possibilities within the total search space.
Third, understanding the intricate connection between theoretical concepts and practical applications is paramount for developing an improved method for enhancing walkability, addressing existing walking habits, and promoting physical activity in urban contexts, particularly in developing countries. This process is thoroughly outlined in the Method section and proves most effective when authors or stakeholders have a comprehensive understanding of it. However, as emphasized in previous studies in the Introduction and Case study sections, broad collaboration among relevant stakeholders such as city planners, designers, urban or public-related professionals, and architects is essential. This collaborative effort can significantly enhance the practical application of this method and allocate substantial resources to advance its development.
Fourth, methodological integration and implementation are advantageous in this context, without excluding exploration of new possibilities in alternative scenarios. Although the authors have not simulated this method in other contexts, as long as the method and data collection align with theoretical concepts and practical applications tailored to specific contexts (as mentioned in the Method section), the DML method and its principles remain highly applicable. It is imperative to address key elements such as connectivity, relevancy, and optimizing transit-oriented movement between Nodes (coordinates) and Routes (agent trails and walking behavior), as illustrated in Figure 7. Additionally, customizing parameters is crucial for promoting pedestrian-centric urban design, physical exercise, and connectivity in urban communities, making it adaptable to various contextual characteristics.
In summary, this research focuses on WM using the DML method. It emphasizes the importance of understanding the context and characteristics, incorporating ABMS and field walkability observations for behavioral exploration. The study addresses challenges related to data quantification and decision-making, advocating for stakeholder collaboration to enhance practical applications. Furthermore, it highlights methodological integration and adaptability across various contexts, aiming to advance sustainable and livable pedestrian-centric TOD cities. Through comprehensive methodologies and potential collaboration opportunities, the study provides valuable insights into optimizing urban environments for improved walkability and human activity.
5. Limitations#
The study primarily focuses on enhancing walkability through refining pedestrian pathways and city features. However, limitations arise during the implementation of the DML method. The main limitations of this experimentation are as follows: First, the generalizability of the DML method is limited to being applied to diverse urban contexts. Which per nowDML, including issues such as traffic congestion, walkability challenges, urban development, and the availability of public spaces. It requires tailoring the formulation of FOs in Layer 5, which may need additional adjustments for universal applicability. While engines like Wallacei help urban planners access the method, further adaptation might be necessary. Future research should integrate advanced parameters tailored to specific urban phenomena and involve stakeholders in validating the implementation of the DML method within its context.
Second, navigating various software and frameworks associated with the DML method can pose challenges for end-users. Developing an expanded version of the DML method within a single independent software can improve accessibility and streamline workflow, especially for urban software developers. For further enhancements, creating dedicated software or plugins integrated into commonly used platforms like Rhino and Grasshopper is necessary for widespread global availability and a user-friendly experience.
Fourth, the algorithms chosen in Layers 2, 3, and 4 are grounded in practical considerations but may not universally apply to urban workflows, particularly in experimental methodologies like this. For instance, 2D ABMS in Layer 2 may not account for cities with intricate 3D features such as flyovers or underground infrastructure. Smoothing algorithms in Layer 3 might necessitate alternative approaches like soft-smoothing or custom considerations not covered here. Similarly, the SPA algorithm in Layer 4 may require further evaluation against alternative algorithms for technical expansion. The authors selected these algorithms based on pertinent studies, indicating that open collaboration between urban and computational researchers is crucial. Moreover, when developing fundamental criteria for algorithm selection, it is valuable to identify those suitable for diverse contexts and exclude those that do not suit.
Fifth, the ISOA method in Layer 6, initially designed to choose the optimal solution from 2500 options, might not be suitable for scenarios requiring multiple solutions, a reduced number of candidate solutions, solely clustered solutions, or direct single solutions. Adaptations are necessary to address diverse contexts. Future research should focus on crafting customized ISOA frameworks tailored to specific contextual needs, integrating machine-, algorithm-, collaborative, and context-driven formulations.
6. Conclusion#
This study has introduced the innovative DML method and assessed its effectiveness through a real case study. In conclusion, this research has expanded insights into the potential applications of the DML process in urban design and architecture. It emphasizes addressing walkability challenges in urban environments. It also highlights the potential of the DML method in promoting TOD and sustainable livable city concepts, with a specific focus on pedestrian-friendly planning. The findings and implementation strategies presented here align closely with existing literature addressing urban and built environment issues. It is crucial to practically implement the recommendations from this study, especially in cities facing similar challenges. Finally, this research significantly enhances our understanding of walkability and its pivotal role in improving physical activity and livability in urban areas.
7. Recommendations#
Further research could explore the applicability of the DML method across diverse urban and cultural contexts, along with its continued development. Moreover, investigating the long-term impacts of improved walkability on public health outcomes could offer valuable insights for urban planners and policymakers. Practical implementation opportunities through the DML method include:
- Urban planners and designers can leverage the developed framework for mapping future TH and PS, addressing prevalent urban challenges.
- The information generated throughout the DML process (Layers 1 to 6) can assist planners and designers in crafting comprehensive and well-informed designs.
- Planners, environmentalists, health advocates, and professionals can utilize early-stage DML processes (Layers 1 and 2) as benchmarks for evaluating future designs and enhancing decision-making.
- Researchers and developers can gain insights from pathways uncovered by the DML method, such as those generated by the A-star algorithm and historical paths from ABMS (Layers 2, 3, and 4), providing an understanding of human movement behavior within TH.
- Relevant stakeholders can exploit and utilize customization options proposed by the DML method to tailor processes for specific objectives and address various ancillary tasks, leveraging acquired contextual data.
References#
- Hadas Y, Ceder A (Avi). Public Transit Network Connectivity: Spatial-Based Performance Indicators. Transp Res Rec 2010; 2143: 1–8. ⌃ ⌃2 ⌃3 ⌃4
- Lima F, Brown N, Duarte J. Urban design optimization: generative approaches towards urban fabrics with improved transit accessibility and walkability. In: Proceedings of the 26th CAADRIA Conference, Hong Kong, 29 March–1 April 2021, The Chinese University of Hong Kong and Online, pp. 719–728. ⌃ ⌃2 ⌃3 ⌃4
- Dhanani A, Stockton J, Vaughan L. Street Mobility Project: Walkability models, https://discovery.ucl.ac.uk/id/eprint/1542310/ (2017). ⌃ ⌃2 ⌃3 ⌃4
- Saelens BE, Sallis JF, Frank LD. Environmental correlates of walking and cycling: Findings from the transportation, urban design, and planning literatures. Ann Behav Med 2003; 25: 80–91. ⌃ ⌃2 ⌃3 ⌃4 ⌃5
- Jabbari M, Fonseca F, Smith G, et al. The pedestrian network concept: A systematic literature review. J Urban Mobil 2023; 3: 100051. ⌃ ⌃2 ⌃3
- Jain R. The urban transformation: Issues and challenges. In: Kateja A, Jain R (eds) Urban Growth and Environmental Issues in India. Singapore: Springer, 2021, pp. 17–34. ⌃ ⌃2
- Nieuwenhuijsen MJ. Urban and transport planning pathways to carbon neutral, liveable and healthy cities; A review of the current evidence. Environ Int 2020; 140: 105661. ⌃ ⌃2 ⌃3 ⌃4
- Zakianis, Adzania FH, Fauzia S, et al. Sociodemographic and environmental health risk factor of COVID-19 in Jakarta, Indonesia: An ecological study. One Health 2021; 13: 100303. ⌃
- Braun LM, Rodriguez DA, Cole-Hunter T, et al. Short-term planning and policy interventions to promote cycling in urban centers: Findings from a commute mode choice analysis in Barcelona, Spain. Transp Res Part Policy Pract 2016; 89: 164–183. ⌃
- Alam SM, Markandey K. Consequences of unplanned growth: A case study of metropolitan Hyderabad. In: Thakur RR, Dutt AK, Thakur SK, et al. (eds) Urban and Regional Planning and Development: 20th Century Forms and 21st Century Transformations. Cham: Springer International Publishing, pp. 203–219. ⌃
- Nero BF, Callo-Concha D, Anning A, et al. Urban green spaces enhance climate change mitigation in cities of the global south: The case of Kumasi, Ghana. Procedia Eng 2017; 198: 69–83. ⌃ ⌃2 ⌃3
- Yin L. Assessing walkability in the city of Buffalo: Application of agent-based simulation. J Urban Plan Dev 2013; 139: 166–175. ⌃ ⌃2 ⌃3
- Lwin KK, Murayama Y. Modelling of urban green space walkability: Eco-friendly walk score calculator. Comput Environ Urban Syst 2011; 35: 408–420. ⌃ ⌃2
- Pinto NN, Tenedório JA, Antunes AP, et al. (eds). Technologies for urban and spatial planning: Virtual cities and territories. Hershey, PA, USA: IGI Global, 2013. ⌃ ⌃2
- An L, Grimm V, Sullivan A, et al. Challenges, tasks, and opportunities in modeling agent-based complex systems. Ecol Model 2021; 457: 109685. ⌃ ⌃2 ⌃3 ⌃4 ⌃5
- Kagho GO, Balac M, Axhausen KW. Agent-based models in transport planning: Current state, issues, and expectations. Procedia Comput Sci 2020; 170: 726–732. ⌃
- Eloah A, Queiroz N, Coelho L. Parametric Urbanism: Multi-criteria optimization for a sustainable neighborhood in São José dos Campos. In: Gomez P, Brada (eds) Proceedings of the XXV International Conference of theIbero-American Society of Digital Graphics (SiGraDi 2021), Online, 8–12 November 2021, pp. 351–364 ⌃ ⌃2 ⌃3
- Dutt AK, Mookherjee D, Thakur RR, et al. Regional development and planning: An overview. In: Thakur RR, Dutt AK, Thakur SK, et al. (eds) Urban and Regional Planning and Development: 20th Century Forms and 21st Century Transformations. Cham: Springer International Publishing, pp. 23–58. ⌃ ⌃2
- Tijana Đ, Tomić N, Tešić D. Walkability and bikeability for sustainable spatial planning in the city of Novi Sad (Serbia). Sustainability 2023; 15: 3785. ⌃ ⌃2
- Ghaffarian M, Fallah R, Jacob C. Organic architectural spatial design driven by agent-based crowd simulation. In: Proceedings of the Symposium on Simulation for Architecture and Urban Design. San Diego, CA, USA: Society for Computer Simulation International, 2018, pp. 1–8. ⌃ ⌃2
- Zuniga-Teran AA, Orr BJ, Gimblett RH, et al. Designing healthy communities: Testing the walkability model. Front Archit Res 2017; 6: 63–73. ⌃ ⌃2
- Baharlou E, Menges A. Toward a behavioral design system: an agent-based approach for polygonal surfaces structures. In: Proceedings of the 35th Annual Conference of the Association for Computer Aided Design in Architecture (ACADIA): Computational Ecologies: Design in the Anthropocene, Cincinnati, October 2015, ACADIA, pp. 161–172. ⌃
- Yen T-W, Filippov M, Cheong SA. Emergent urban morphologies in an agent-based model of housing. In: Chakrabarti AS, Pichl L, Kaizoji T (eds) Network Theory and Agent-Based Modeling in Economics and Finance. Singapore: Springer, pp. 227–246. ⌃
- Marwal A, Silva EA. City affordability and residential location choice: A demonstration using agent based model. Habitat Int 2023; 136: 102816. ⌃ ⌃2
- Zhu W, Nedovic-Budic Z, Olshansky RB, et al. Agent-based modeling of physical activity behavior and environmental correlations: An introduction and illustration. J Phys Act Health 2013; 10: 309–322. ⌃
- Siqueira Reis R, Hino AAF, Ricardo Rech C, et al. Walkability and physical activity: Findings from Curitiba, Brazil. Am J Prev Med 2013; 45: 269–275. ⌃
- Abar S, Theodoropoulos GK, Lemarinier P, et al. Agent Based Modelling and Simulation tools: A review of the state-of-art software. Comput Sci Rev 2017; 24: 13–33. ⌃
- Yang L, Gilbert N. Getting away from numbers: using qualitative observation for agent-based modeling. Adv Complex Syst 2008; 11: 175–185. ⌃
- Hassan S, Pavón J, Antunes L, et al. Injecting data into agent-based simulation. In: Takadama K, Cioffi-Revilla C, Deffuant G (eds) Simulating Interacting Agents and Social Phenomena. Tokyo: Springer Japan, 2010, pp. 177–191. ⌃
- Manzo G, Matthews T. Potentialities and limitations of agent-based simulations. Rev Francaise Sociol 2014; 55: 653–688. ⌃
- Lefebvre-Ropars G, Morency C. Walkability: Which measure to choose, where to measure it, and how? Transp Res Rec 2018; 2672: 139–150. ⌃
- Ibraeva A, Correia GH de A, Silva C, et al. Transit-oriented development: A review of research achievements and challenges. Transp Res Part Policy Pract 2020; 132: 110–130. ⌃ ⌃2 ⌃3 ⌃4 ⌃5 ⌃6
- Chen L. Agent-based modeling in urban and architectural research: A brief literature review. Front Archit Res 2012; 1: 166–177. ⌃
- Badland H, White M, MacAulay G, et al. Using simple agent-based modeling to inform and enhance neighborhood walkability. Int J Health Geogr 2013; 12: 58. ⌃ ⌃2
- Herrmann T, Boisjoly G, Ross NA, et al. The missing middle: filling the gap between walkability and observed walking behavior. Transp Res Rec 2017; 2661: 103–110. ⌃
- Lu X. The development and deployment of walkability assessment models for built environments. Thesis, Aalto University, https://aaltodoc.aalto.fi/handle/123456789/28966 (2017, accessed 21 June 2023). ⌃
- Kanchik M. Geographic information systems analysis of walkability data for the Atlanta Beltline communities. Public Health Capstone Proj. Epub ahead of print 2017. DOI: 10.57709/10501417. ⌃
- Franěk M. Environmental factors influencing pedestrian walking speed. Percept Mot Skills 2013; 116: 992–1019. ⌃
- Zhang S, Deng N. Simulation & visualization of walkability score. Data Mining the City, https://medium.com/data-mining-the-city/simulation-visualization-of-walkability-score-ef88d5893301 (2019, accessed 13 October 2023). ⌃
- Xiang L, Tan Y, Shen G, et al. Applications of multi-agent systems from the perspective of construction management: A literature review. Eng Constr Archit Manag 2022; 29: 3288–3310. ⌃
- González-Méndez M, Olaya C, Fasolino I, et al. Agent-based modeling for urban development planning based on human needs. conceptual basis and model formulation. Land Use Policy 2021; 101: 105110. ⌃ ⌃2
- Zhang W, Valencia A, Chang N-B. Synergistic integration between machine learning and agent-based modeling: A multidisciplinary review. IEEE Trans Neural Netw Learn Syst 2023; 34: 2170–2190. ⌃ ⌃2
- Shendarkar A, Vasudevan K, Lee S, et al. Crowd simulation for emergency response using BDI agents based on immersive virtual reality. Simul Model Pract Theory 2008; 16: 1415–1429. ⌃
- Stieler D, Schwinn T, Leder S, et al. Agent-based modeling and simulation in architecture. Autom Constr 2022; 141: 104426. ⌃
- Google Maps Help. Use layers to find places, traffic, terrain, biking & transit, https://support.google.com/maps/answer/3092439? (accessed 6 March 2024). ⌃
- Petrovska N, Stevanovic A. Traffic Congestion Analysis Visualisation Tool. In: 2015 IEEE 18th International Conference on Intelligent Transportation Systems. Gran Canaria, Spain: IEEE, pp. 1489–1494. ⌃
- Hilpert M, Shearston JA, Cole J, et al. Acquisition and analysis of crowd-sourced traffic data. arXiv. Epub ahead of print 25 May 2021. DOI: 10.48550/arXiv.2105.12235. ⌃ ⌃2
- Pokorný P. Determining Traffic Levels in Cities Using Google Maps. In: 2017 Fourth International Conference on Mathematics and Computers in Sciences and in Industry (MCSI). 2017, pp. 144–147. ⌃ ⌃2 ⌃3
- Kaziyeva D, Stutz P, Wallentin G, et al. Large-scale agent-based simulation model of pedestrian traffic flows. Comput Environ Urban Syst 2023; 105: 102021. ⌃ ⌃2 ⌃3
- Yin L. Street level urban design qualities for walkability: Combining 2D and 3D GIS measures. Comput Environ Urban Syst 2017; 64: 288–296. ⌃ ⌃2
- Yin L, Wang Z. Measuring visual enclosure for street walkability: Using machine learning algorithms and Google Street View imagery. Appl Geogr 2016; 76: 147–153. ⌃
- Duncan DT, Aldstadt J, Whalen J, et al. Validation of Walk Score® for Estimating neighborhood walkability: An analysis of four US metropolitan areas. Int J Environ Res Public Health 2011; 8: 4160–4179. ⌃
- Norberg-Schulz C. Genius loci: Towards a phenomenology of architecture. Rizzoli, 1979. ⌃ ⌃2 ⌃3 ⌃4
- Noto AP, Saputro DRS. Classification data mining with Laplacian Smoothing on Naïve Bayes method. Surakarta, Indonesia, p. 030004. ⌃
- Field DA. Laplacian smoothing and Delaunay triangulations. Commun Appl Numer Methods 1988; 4: 709–712. ⌃ ⌃2
- Coello Coello CA. Evolutionary multi-objective optimization: a historical view of the field. IEEE Comput Intell Mag 2006; 1: 28–36. ⌃
- Huang Z, Ding J, Xiang S. Suspension Footbridge Form-Finding with Laplacian Smoothing Algorithm. Int J Steel Struct 2020; 20: 1989–1995. ⌃ ⌃2 ⌃3
- Xiao L, Yang G, Zhao K, et al. Efficient Parallel Algorithms for 3D Laplacian Smoothing on the GPU. Appl Sci 2019; 9: 5437. ⌃ ⌃2 ⌃3
- Alieksieiev V. Artificial Locust Swarm Routing Algorithm: : An Approach to Consider both Routing via FRA and Applying RAD. In: 2019 International Conference on Information and Digital Technologies (IDT). Zilina, Slovakia: IEEE, pp. 1–10. ⌃ ⌃2
- Mittal D, Turrin M, Tenpierik MJ, et al. framework for multi-agent and acoustic simulation for office design. In: Proceedings of the 12th Annual Symposium on Simulation for Architecture and Urban Design, San Diego, CA, USA, 15–17 April 2021, Society for Computer Simulation International, pp. 9. ⌃
- Hart PE, Nilsson NJ, Raphael B. A Formal Basis for the Heuristic Determination of Minimum Cost Paths. IEEE Trans Syst Sci Cybern 1968; 4: 100–107. ⌃ ⌃2
- Deb K, Pratap A, Agarwal S, et al. A fast and elitist multiobjective genetic algorithm: NSGA-II. IEEE Trans Evol Comput 2002; 6: 182–197. ⌃ ⌃2 ⌃3
- Deb K, Agrawal S, Pratap A, et al. A Fast Elitist Non-dominated Sorting Genetic Algorithm for Multi-objective Optimization: NSGA-II. In: Parallel Problem Solving from Nature PPSN VI. Berlin, Heidelberg: Springer, 2000, pp. 849–858. ⌃ ⌃2 ⌃3
- Wijaya CA. Tilted, disjointed bridges make life harder for city’s pedestrians. The Jakarta Post, https://www.thejakartapost.com/news/2018/09/08/tilted-disjointed-bridges-make-life-harder-city-s-pedestrians.html (2018, accessed 1 March 2024). ⌃ ⌃2 ⌃3
- Leather J, Fabian H, Gota S, et al. Walkability and pedestrian facilities in Asian cities, https://www.adb.org/publications/walkability-and-pedestrian-facilities-asian-cities-state-and-issues (2011). ⌃ ⌃2 ⌃3
- Krambeck HV. The global walkability index. Thesis, Massachusetts Institute of Technology, https://dspace.mit.edu/handle/1721.1/34409 (2006, accessed 1 March 2024). ⌃
- Institute for Transportation and Development Policy. Panduan Desain Fasilitas Pejalan Kaki: DKI Jakarta 2017 – 2022. Institute for Transportation and Development Policy, https://itdp-indonesia.org/publication/panduan-desain-fasilitas-pejalan-kaki-dki-jakarta-2017-2022/ (2020, accessed 22 November 2022). ⌃ ⌃2
- Salim HJ. Waspada! Titik-titik rawan kejahatan di Terminal Kalideres. Liputan6, 1 August 2013, https://www.liputan6.com/news/read/655880/ (1 August 2013, accessed 24 April 2022). ⌃ ⌃2 ⌃3
- Winarno FG, Allain A. Street foods in developing countries: lessons from Asia. Food Nutr Agric 1991; 1: 11–18. ⌃ ⌃2 ⌃3
- Pemerintah Daerah Daerah Khusus Ibukota Jakarta. Peraturan Gubernur Daerah Khusus Ibukota Jakarta Nomor 31 Tahun 2022 tentang Rencana Detail Tata Ruang Wilayah Perencanaan Provinsi Daerah Khusus Ibukota Jakarta. 2022. ⌃
- AH2. Wikipedia, https://en.wikipedia.org/w/index.php?title=AH2&oldid=1210543283 (2024, accessed 15 March 2024). ⌃
- Google Maps. Kalideres · Daan Mogot Rd, East Cengkareng, Cengkareng, West Jakarta City, Jakarta, https://maps.app.goo.gl/oSMQS8ssWUxBxxSHA (2022, accessed 24 May 2022). ⌃
- Institute for Transportation and Development Policy. TOD Standard 3.0. Institute for Transportation and Development Policy, https://itdp-indonesia.org/2017/07/tod-standard-3/ (2017, accessed 22 November 2022). ⌃ ⌃2 ⌃3 ⌃4 ⌃5 ⌃6
- López Baeza J, Carpio-Pinedo J, Sievert J, et al. Modeling pedestrian flows: Agent-based simulations of pedestrian activity for land use distributions in urban developments. Sustainability 2021; 13: 9268. ⌃
- Baobeid A, Koç M, Al-Ghamdi SG. Walkability and its relationships with health, sustainability, and livability: Elements of physical environment and evaluation frameworks. Front Built Environ 2021; 7: 721218. ⌃ ⌃2
- World Bank Group. Jakarta - Urban challenges in a changing climate. Text/HTML, Washington, D.C.: World Bank Group, http://documents.worldbank.org/curated/en/132781468039870805/Jakarta-Urban-challenges-in-a-changing-climate (18 October 2011). ⌃
- Roberts M, Gil Sander F, Tiwari S (eds). Time to ACT: Realizing Indonesia’s urban potential. Washington, D.C: World Bank, 2019. ⌃
- Ferdman A. Walking and its contribution to objective well-being. J Plan Educ Res 2023; 43: 294–304. ⌃ ⌃2 ⌃3
- Thompson CW. Urban open space in the 21st century. Landsc Urban Plan 2002; 60: 59–72. ⌃
- Lee ACK, Maheswaran R. The health benefits of urban green spaces: a review of the evidence. J Public Health 2011; 33: 212–222. ⌃ ⌃2
- Kondo MC, Fluehr JM, McKeon T, et al. Urban green space and its impact on human health. Int J Environ Res Public Health 2018; 15: 445. ⌃ ⌃2
- Wardani DA. Build a transport hub in Dukuh Atas, Anies: we hope for a new atmosphere change. VOI. October 2021, https://voi.id/en/news/94220 (accessed 13 October 2023). ⌃
- Setiowati R, Hasibuan HS, Koestoer RH. Green open space masterplan at Jakarta Capital City, Indonesia for climate change mitigation. IOP Conf Ser Earth Environ Sci 2018; 200: 012042. ⌃ ⌃2
- U. S. Green Building Council. LEED v4.1, https://www.usgbc.org/leed/v41#cities-and-communities (2023, accessed 13 October 2023). ⌃
- Atiqul Haq SM. Urban green spaces and an integrative approach to sustainable environment. J Environ Prot 2011; 02: 601–608. ⌃ ⌃2 ⌃3
- Belzer D, Autler G. Transit oriented development: moving from rhetoric to reality. Washington, DC: Brookings Institution Center on Urban and Metropolitan Policy, 2002. ⌃ ⌃2
- Taki HM, Maatouk MMH, Ahmadi F. Implementation of the Integrated TOD Spatial Model for Jakarta Metropolitan Region. KnE Soc Sci 2019; 234–246. ⌃
- Aryaguna PA, Gaffara GR, Sari DAK, et al. Green open space priority modelling using GIS analysis in West Jakarta. Indones J Geogr 2022; 54: 263–271. ⌃
- Zhang Y, Azzali S, Janssen P, et al. Design for walkable neighbourhoods in Singapore using form-based codes. In: Proceedings of International Forum of Urbanism (IFoU) 2018: Reframing Urban Resilience Implementation: Aligning Sustainability and Resilience, Barcelona, December 2018, MDPI, p. 5934. ⌃
- Singh R. Factors affecting walkability of neighborhoods. Procedia - Soc Behav Sci 2016; 216: 643–654. ⌃
- Azizi V, Usman M, Sohn SS, et al. The role of latent representations for design space exploration of floorplans. SIMULATION 2023; 99: 1167–1179. ⌃
- Veisi O, Du D, Moradi MA, et al. Designing SafeMap Based on City Infrastructure and Empirical Approach: Modified A-Star Algorithm for Earthquake Navigation Application. In: Proceedings of the 1st ACM SIGSPATIAL International Workshop on Advances in Urban-AI. Hamburg Germany: ACM, pp. 61–70. ⌃
- Pasandi L, Hooshmand M, Rahbar M. Modified A* Algorithm integrated with ant colony optimization for multi-objective route-finding; case study: Yazd. Appl Soft Comput 2021; 113: 107877. ⌃
- Bhatia S. Survey of shortest path algorithms. Int J Comput Sci Eng 2019; 6: 33–39. ⌃
- Hong Z, Sun P, Tong X, et al. Improved A-star algorithm for long-distance off-road path planning using terrain data map. ISPRS Int J Geo-Inf 2021; 10: 785. ⌃
- Cai D, He X, Han J. Document clustering using locality preserving indexing. IEEE Trans Knowl Data Eng 2005; 17: 1624–1637. ⌃
- Chan ETH, Schwanen T, Banister D. Towards a multiple-scenario approach for walkability assessment: An empirical application in Shenzhen, China. Sustain Cities Soc 2021; 71: 102949. ⌃
- Ridha E, Nolting L, Praktiknjo A. Complexity profiles: A large-scale review of energy system models in terms of complexity. Energy Strategy Rev 2020; 30: 100515. ⌃
- Toussi HE. The application of evolutionary, generative, and hybrid approaches in architecture design optimization. NEU J Fac Archit NEU-JFA 2020; 2: 1–20. ⌃ ⌃2
- Robert McNeel & Associates. Rhinoceros 3D, https://www.rhino3d.com/ (2022, accessed 22 November 2022). ⌃
- Robert McNeel & Associates. Grasshopper, https://www.grasshopper3d.com/ (2022, accessed 22 November 2022). ⌃ ⌃2
- Belesky P. Caribou, https://caribou.philipbelesky.com/ (2022, accessed 22 November 2022). ⌃
- Ashish. How does google maps know about traffic conditions? Science ABC, https://www.scienceabc.com/innovation/how-does-google-maps-know-about-traffic-conditions.html (2016, accessed 7 March 2024). ⌃
- The Times of India. How does Google map detect traffic? The Times of India, https://timesofindia.indiatimes.com/etimes/trending/how-does-google-map-detect-traffic/photostory/107174551.cms (2024, accessed 7 March 2024). ⌃
- Fischer A. Quelea - agent-based design for Grasshopper. Food4Rhino, https://www.food4rhino.com/en/app/quelea-agent-based-design-grasshopper (2015, accessed 22 November 2022). ⌃
- Pryor M. Bundling/wooly paths. Grasshopper, https://www.grasshopper3d.com/forum/topics/bundling-wooly-paths?commentId=2985220%3AComment%3A1739714 (2017, accessed 9 October 2023). ⌃
- Preim B, Botha C. Chapter 6 - Surface rendering. In: Preim B, Botha C (eds). Visual Computing for Medicine. 2nd ed. Boston: Morgan Kaufmann, 2014, pp. 229–267. ⌃
- Zwierzycki M. Anemone, https://www.food4rhino.com/en/app/anemone (2013, accessed 1 November 2023). ⌃
- UN Sustainable Development Goals. The Sustainable Development Goals Report 2022, https://unstats.un.org/sdgs/report/2022/Goal-11 (2022, accessed 22 November 2022). ⌃
- Piker D. Kangaroo Physics, https://www.food4rhino.com/en/app/kangaroo-physics (2010, accessed 22 November 2022). ⌃
- Cryptid. Arachne, https://www.food4rhino.com/en/app/arachne (2022, accessed 22 November 2022). ⌃
- Makki M, Farzaneh A, Navarro D. The evolutionary adaptation of urban tissues through computational analysis. Vienna, Austria, pp. 563–571. ⌃
- Andersson C. Public space and the new urban agenda. J Public Space 2016; 1: 5–10. ⌃
- Elshater AM, Ibraheem F. From typology concept to smart transportation hub. Procedia - Soc Behav Sci 2014; 153: 531–541. ⌃
- Asian Development Bank. Improving interchanges: Introducing best practices on multimodal interchange hub development in the People’s Republic of China. Mandaluyong City, Philippines: Asian Development Bank, https://www.adb.org/publications/improving-interchanges-multimodal-interchange-hub-development-prc (2015). ⌃
- Makki M, Showkatbakhsh M, Song Y. Wallacei Primer 2.0, Wallacei. https://www.wallacei.com (2019, accessed 22 May 2022). ⌃ ⌃2
Recent Posts #
WorksBeyond Static
ConceptsNiwakaform

ConceptsWeightless