Walkability model using dynamic multi-layer method in transit hub design in West Jakarta
Details
Publisher
Architecture ITB
Course
Thesis
Advisor
Aswin Indraprastha
Jury
M. Donny Koerniawan; Heru W. Poerbo
Cite
Information#
- Full text access available at: Full text.
A. Appendix#
A.1. Non-architectural theoretical references#
This section outlines the non-architectural theories employed in the thesis, including data clustering (distillation and data subset), Laplacian smoothing (LS), the Shortest Path Algorithm (SPA) and A-star (A*) algorithm, as well as the NSGA-2 and Pareto front (PF).
A.1.1. Data distillation and subset#
A.1.1.1. Principle and process of data distillation#

Data distillation reduces repetitive data into a single set. It is used to build new profiles—for example, to determine interest rates in banking or select optimal materials in manufacturing (Inmon et al., 2020).
A.1.1.2. Principle and process of data subsetting#
Following distillation, data is further filtered into subsets to avoid bias and simplify analysis. This aids in selecting relevant and insightful data (Inmon et al., 2020).
A.1.2. LS#
A.1.2.1. Definition and working principle#
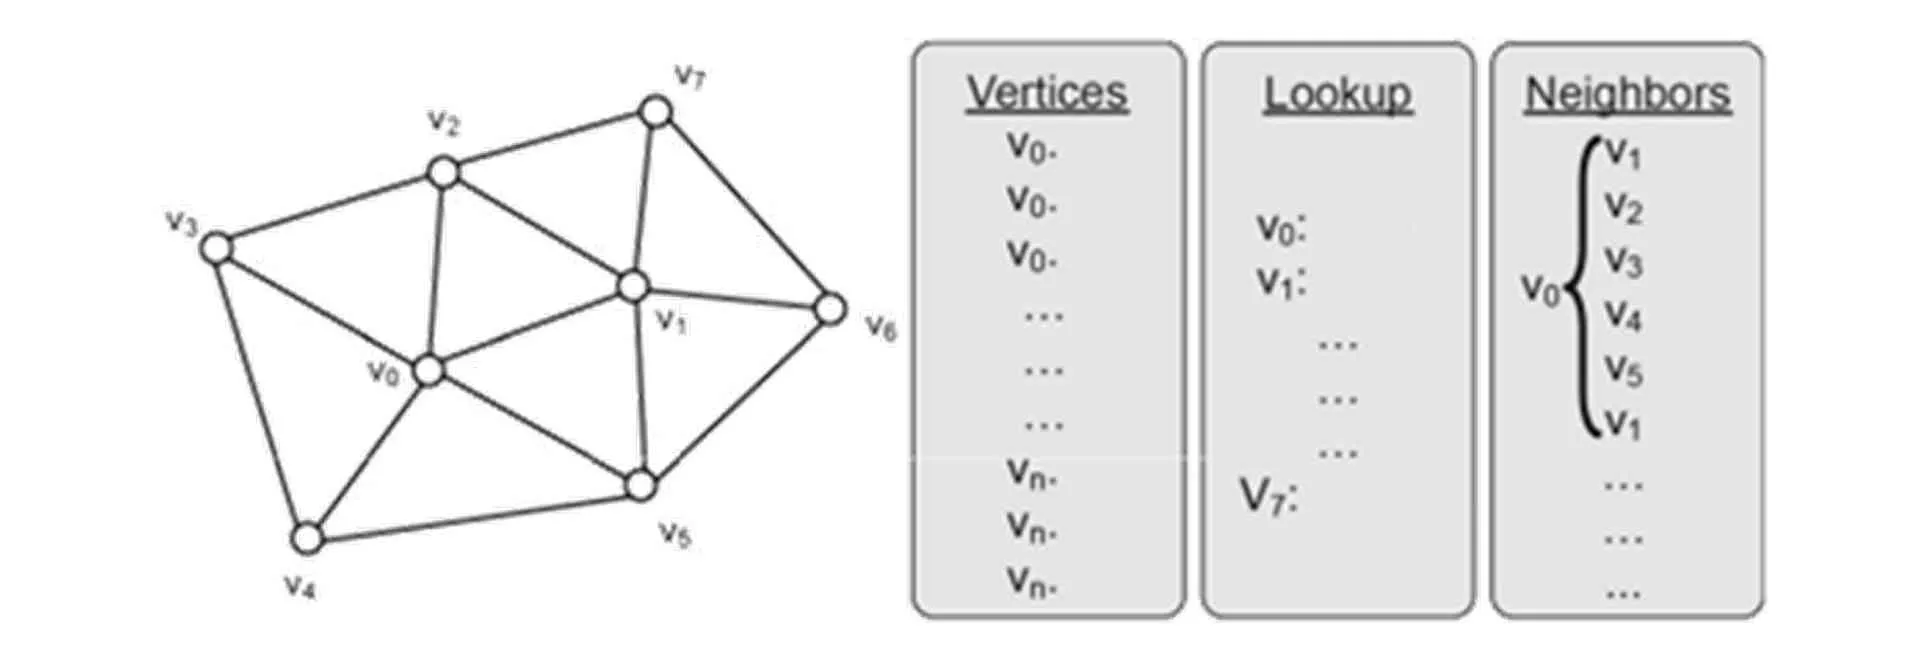
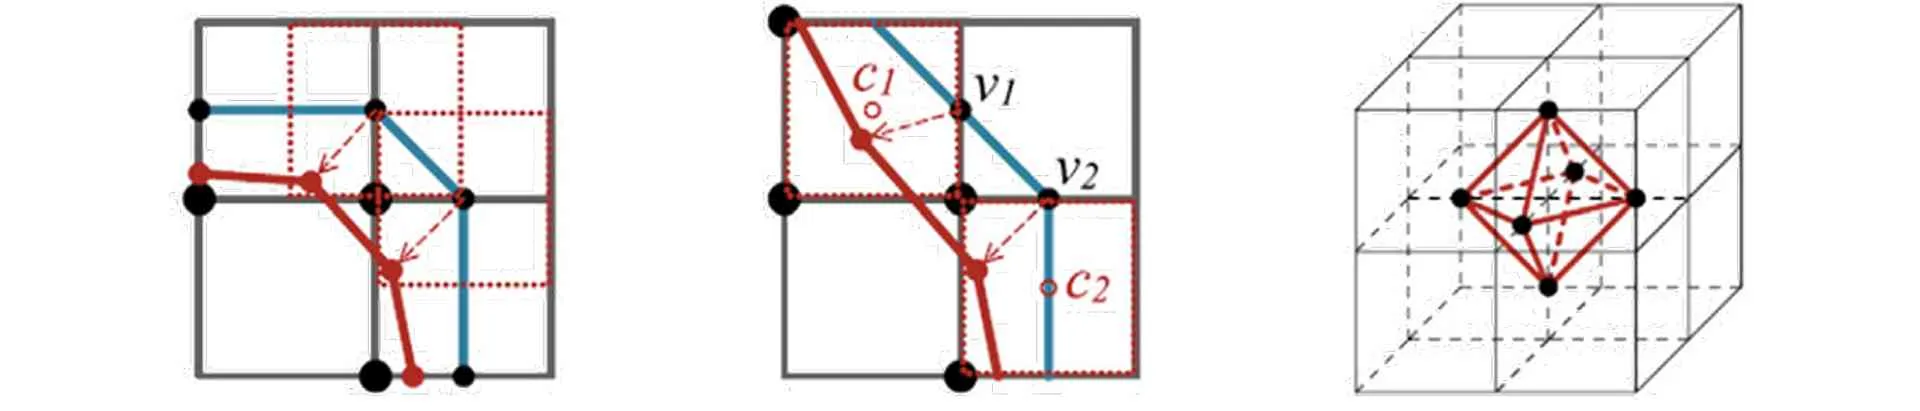
LS is a geometry-based algorithm that reorganizes and smooths meshes by adjusting node positions. It improves mesh quality while preserving the original topology (Huang et al., 2020; Xiao et al., 2019).
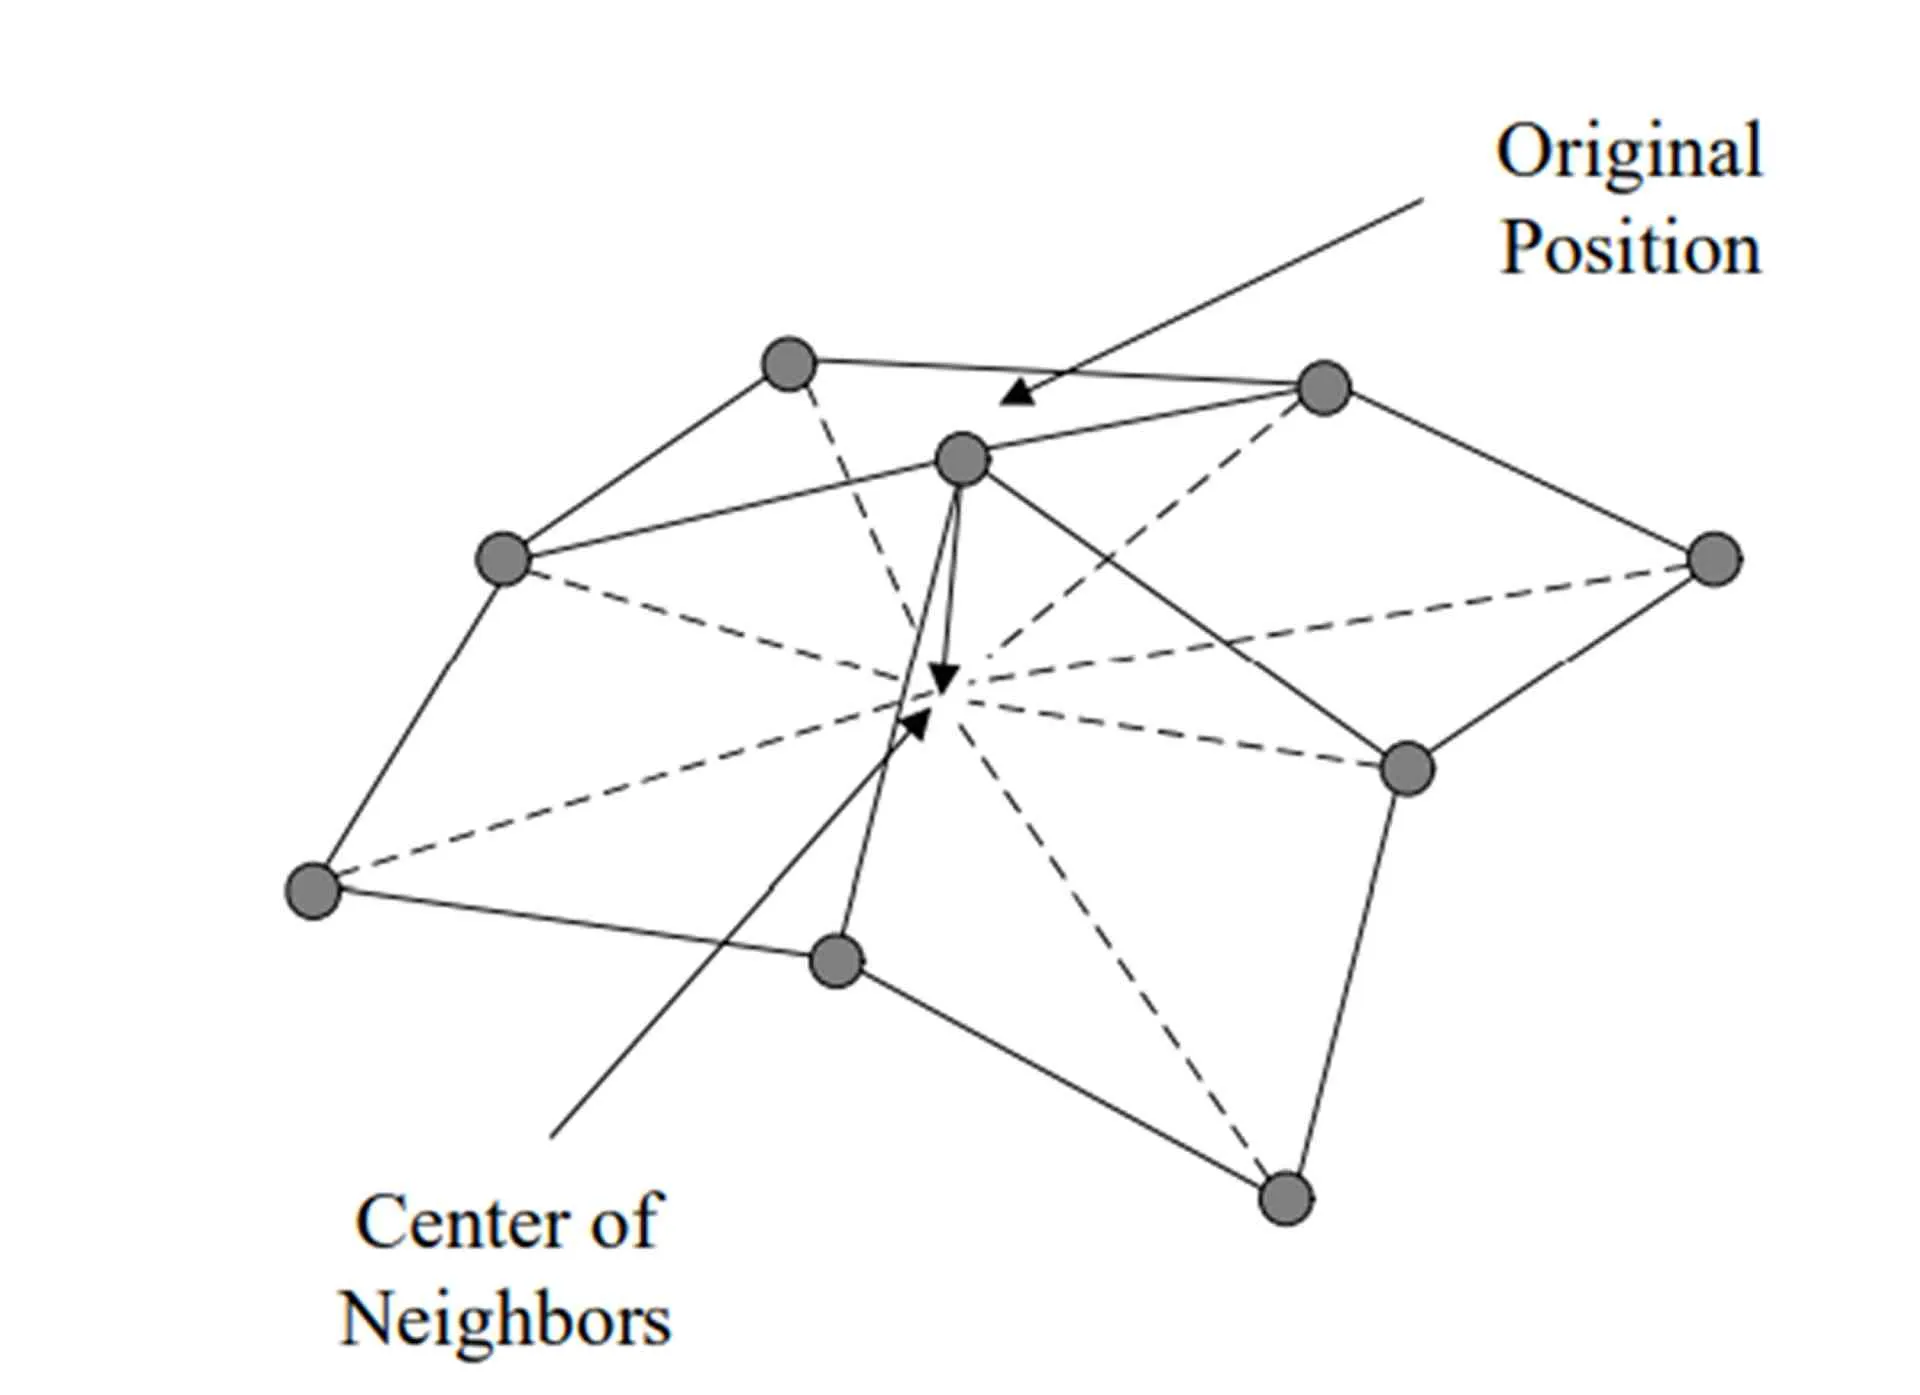
A.1.2.2. Iterative process of LS#
In the repositioning process, point A is the initial coordinate and point B is the final coordinate, computed iteratively from the previous point (Xiao et al., 2019).
Where is the number of neighboring nodes and is the new coordinate after smoothing and iteration (Xiao et al., 2019).
Where and are derived from and . If , then Equation A.1 applies (Xiao et al., 2019).
A.1.2.3. Purpose and Application of LS#
LS can be used in geometric modeling via software such as Rhino and Grasshopper. Though lacking a linear algebra library, the algorithm’s iterations let users create balanced models between accuracy and speed. LS is also flexible and applicable across various design phases (Huang et al., 2020).
A.1.3. Shortest path algorithm (SPA) and the A* algorithm#
A.1.3.1. Historical development#
SPA emerged from network modeling needs to identify shortest routes:
- 1955 – Dantzig formalized the shortest path problem.
- 1957 – Minty used web string and knot representations.
- 1959 – Ford introduced negative arc lengths.
- 1959 – Dijkstra created a simpler version with minimal data storage, still widely used today.
- 1968 – Hart et al. introduced A* with cost estimation for route completion.
In the past 50 years, A* has been refined and applied to telephone routing, communication networks, and transport systems (Zeng and Church, 2009).
A.1.3.2. Function and strengths of A*#
A* finds shortest routes by aligning paths with existing networks (Schneider et al., 2011).
- Optimization can be achieved using evolutionary algorithms like Galapagos.
- A* advantages over Dijkstra: - Searches for sub-optimal solutions, not just the optimal. - Faster and more efficient in directed search ([^Alieksieiev/2019]; [^Mittal-etal/2021]).
A.1.3.3. A* working process#
A* combines heuristic and actual cost (Hart et al., 1968):
- – Actual shortest route from source to node .
- – Estimated distance from to goal .
- – Total temporary shortest cost, updated until algorithm finishes.
A.1.4. NSGA-2 and PF#
NSGA-2, developed by Deb et al., is a widely adopted multi-objective evolutionary algorithm (MOO) (Deb et al., 2000; Deb et al., 2002).
- Improvements over classic NSGA:
- Reduced shared parameters.
- Introduced elitism in selection.
- More efficient non-dominated sorting.
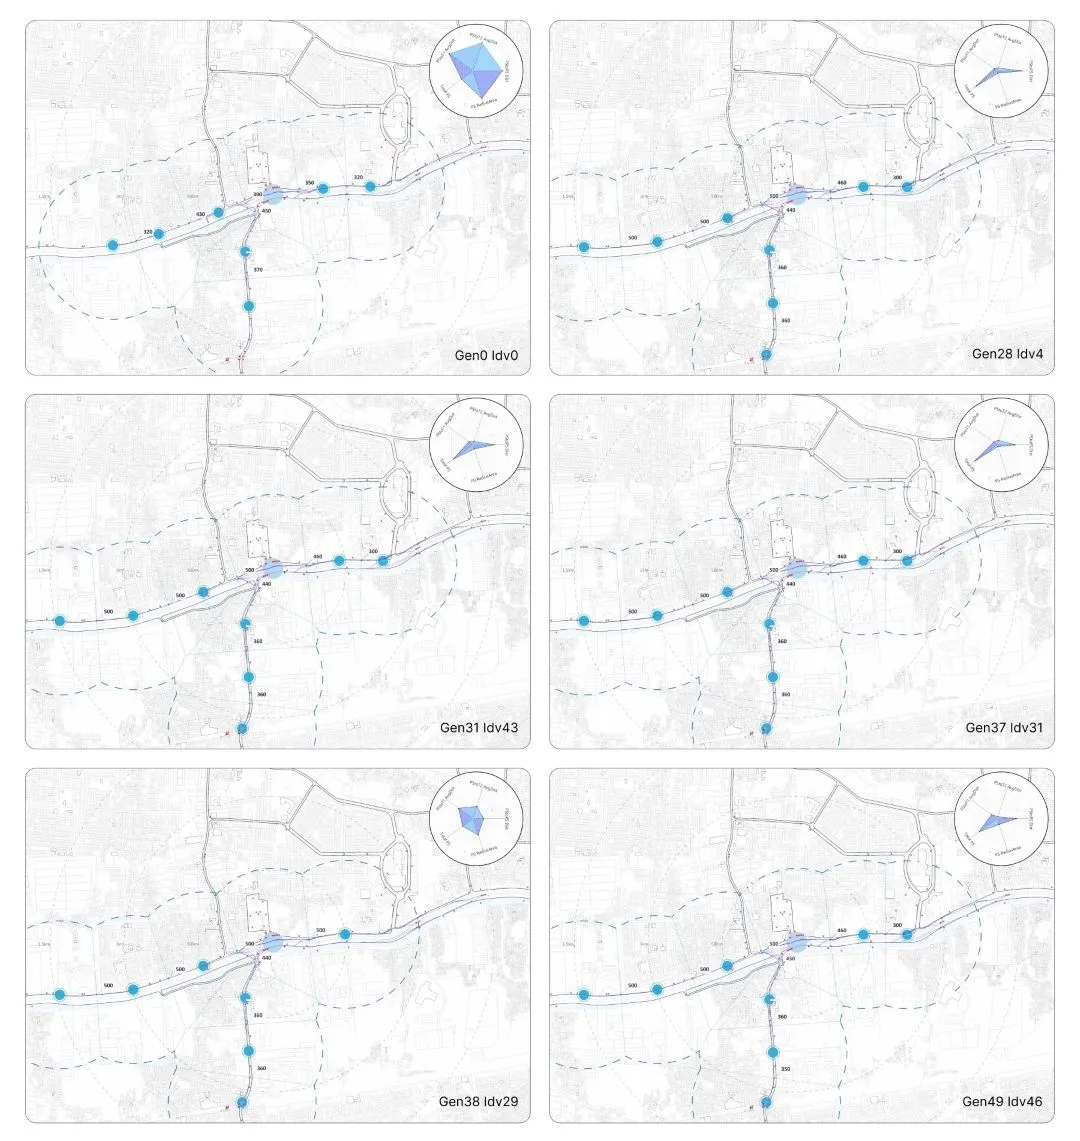
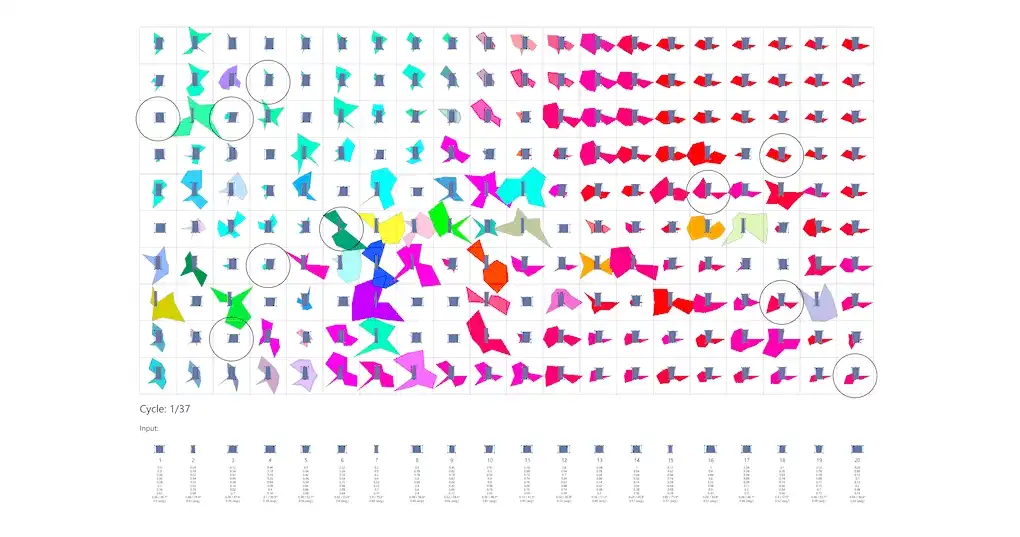
One application that supports NSGA-2 is Wallacei X. It integrates generative algorithms and displays analytical graphs (Huang et al., 2022).
A.1.4.1. Wallacei#
Wallacei was developed by Mohammed Makki during his PhD at the Architectural Association (AA), supervised by Dr. Michael Weinstock (Makki et al., 2019).
- Built on evolutionary computation to solve design problems.
- Focuses on:
- Problem formulation.
- Output analysis.
- Optimized solution selection.
A.1.4.2. Wallacei data analysis#
Wallacei generates several analytic graphs, such as:
- SDG – Standard Deviation Graph (real-time FO visualization).
- SDT – Standard Deviation Trendline (trendline for standard deviation across generations).
- MVT – Mean Value Trendline (average value trend).
- PCP – Parallel Coordinate Plot (PCP visualization from first to last generation).
- DF – Diamond Fitness Chart (DF graph for selected solutions).
- FVG – Fitness Values Graph (fitness values of all population solutions).
A.1.4.3. Wallacei simulation process#
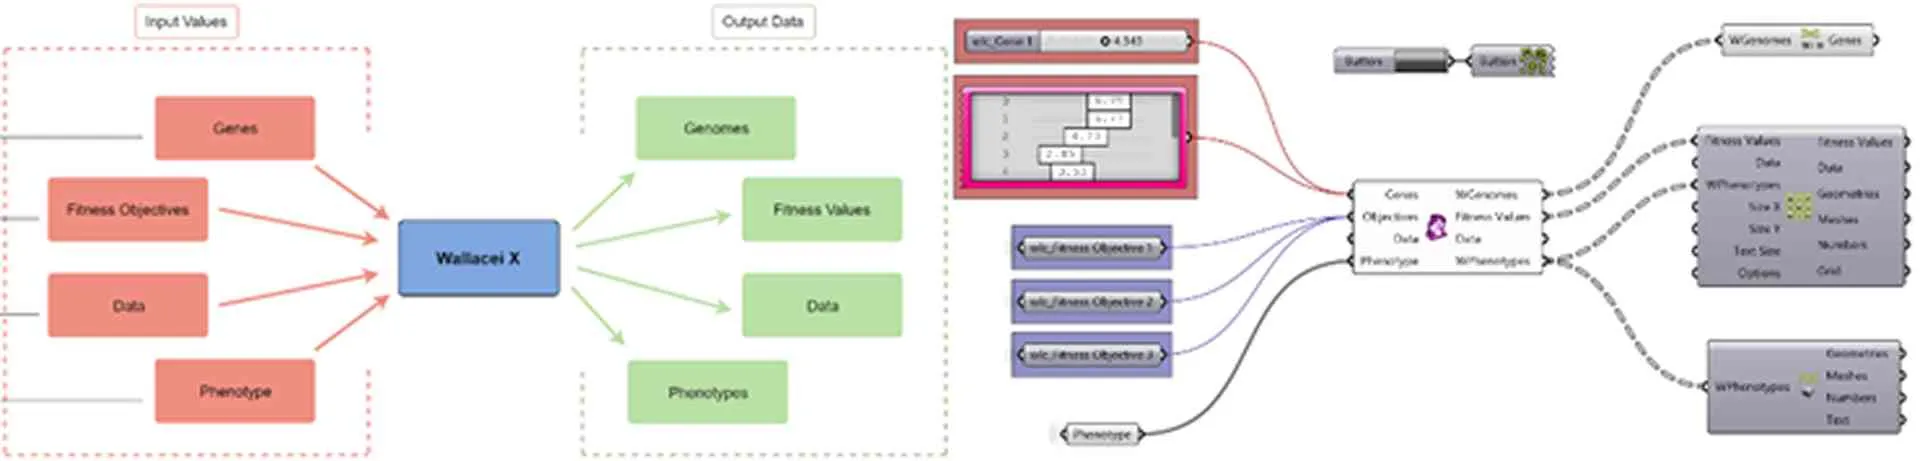
During the input phase, required data includes: Genes, Fitness Objectives/FO, Data, and Phenotypes. After processing in Wallacei X, output values are: Genomes, Fitness Values/FV, Data, and Phenotypes.
Information#
- Full text access available at: Full text.
References#
- Akbari, M., Asadi, P., Besharati Givi, M. K., and Khodabandehlouie, G. (2014): 13 - Artificial neural network and optimization (Woodhead Publishing Series in Welding and Other Joining Technologies), 543–599 in M. K. B. Givi and P. Asadi, ed., Advances in Friction-Stir Welding and Processing, Woodhead Publishing. https://doi.org/10.1533/9780857094551.543 ⌃
- Deb, K., Agrawal, S., Pratap, A., and Meyarivan, T. (2000): A Fast Elitist Non-dominated Sorting Genetic Algorithm for Multi-objective Optimization: NSGA-II, Parallel Problem Solving from Nature PPSN VI, Springer, Berlin, Heidelberg, 849–858. https://doi.org/10.1007/3-540-45356-3_83 ⌃
- Deb, K., Pratap, A., Agarwal, S., and Meyarivan, T. (2002): A fast and elitist multiobjective genetic algorithm: NSGA-II, IEEE Transactions on Evolutionary Computation, 6(2), 182–197. https://doi.org/10.1109/4235.996017 ⌃
- Hart, P. E., Nilsson, N. J., and Raphael, B. (1968): A Formal Basis for the Heuristic Determination of Minimum Cost Paths, IEEE Transactions on Systems Science and Cybernetics, 4(2), 100–107. https://doi.org/10.1109/TSSC.1968.300136 ⌃
- Huang, C., Zhang, G., Yao, J., Wang, X., Calautit, J. K., Zhao, C., An, N., and Peng, X. (2022): Accelerated environmental performance-driven urban design with generative adversarial network, Building and Environment, 224, 109575. https://doi.org/10.1016/j.buildenv.2022.109575 ⌃
- Huang, Z., Ding, J., and Xiang, S. (2020): Suspension Footbridge Form-Finding with Laplacian Smoothing Algorithm, International Journal of Steel Structures, 20(6), 1989–1995. https://doi.org/10.1007/s13296-020-00396-4 ⌃ ⌃2
- Inmon, W. H., and Linstedt, D. (2015): 7.1 - Repetitive Analytics – Some Basics, 231–248 in W. H. Inmon and D. Linstedt, ed., Data Architecture: a Primer for the Data Scientist, Morgan Kaufmann, Boston. https://doi.org/10.1016/B978-0-12-802044-9.00035-0 ⌃ ⌃2
- Li, Q. (March 13, 2018): Laplacian Smoothing and Graph Convolutional Networks, retrieved November 7, 2022, from the website: https://liqimai.github.io/blog/AAAI-18/. ⌃
- Makki, M., Showkatbakhsh, M., and Song, Y. (2019): Wallacei Primer 2.0. ⌃ ⌃2 ⌃3
- Preim, B., and Botha, C. (2014): Chapter 6 - Surface Rendering, 229–267 in B. Preim and C. Botha, ed., Visual Computing for Medicine (Second Edition), Morgan Kaufmann, Boston. https://doi.org/10.1016/B978-0-12-415873-3.00006-7 ⌃ ⌃2
- Schneider, C., Koltsova, A., and Schmitt, G. (2011): Components for parametric urban design in Grasshopper from street network to building geometry., 75, 68. ⌃ ⌃2
- Xiao, L., Yang, G., Yang, K., and Mei, G. (2019): Efficient Parallel Algorithms for 3D Laplacian Smoothing on the GPU, Applied Sciences. https://doi.org/10.3390/app9245437 ⌃ ⌃2 ⌃3 ⌃4 ⌃5
- Zeng, W., and Church, R. L. (2009): Finding shortest paths on real road networks: the case for A*, International Journal of Geographical Information Science, 23(4), 531–543. https://doi.org/10.1080/13658810801949850 ⌃
Recent Posts #
WorksBeyond Static

ConceptsNiwakaform
ConceptsWeightless